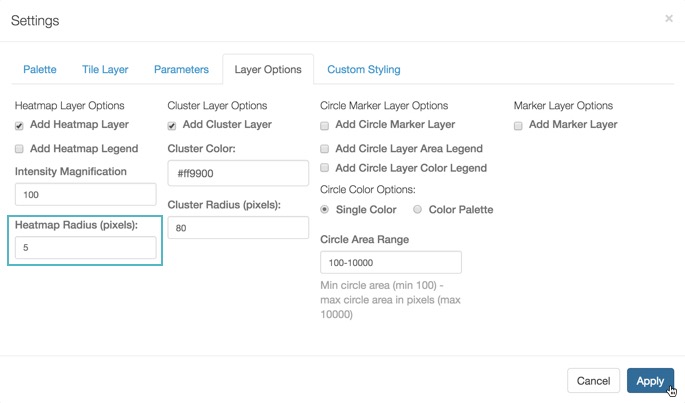
Heatmap Layer Options
The heatmap layer is on by default, along with the cluster layer. The color of the heatmap indicates the value of the aggregate on the Measurements shelf, and it is determined by the color palette. Note also that he heatmap layer includes an optional color legend, which is in gradient form and is based on the color palette.
The intensity magnification multiplies the value of the measure by a constant, and adjust the color display by pushing it 'higher' up the selected color palette. The heatmap radius displays, in pixels, the size of each point.
-
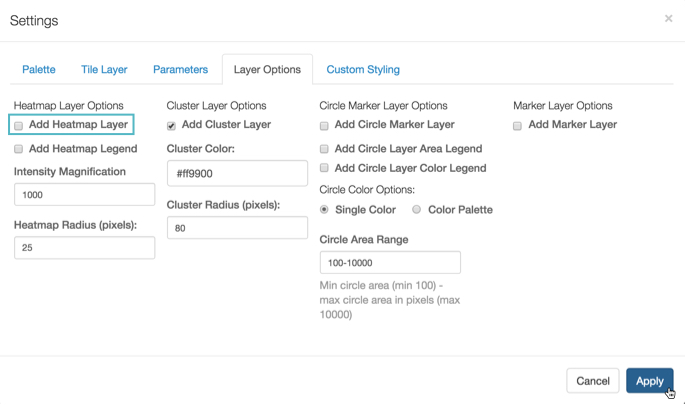
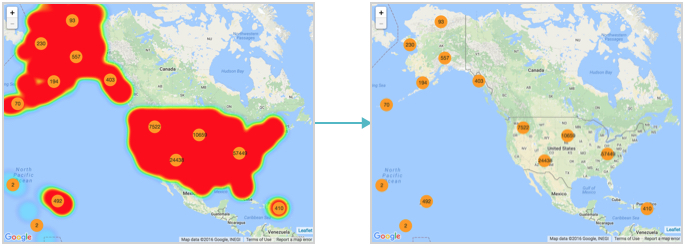
The Heatmap Layer appears on interactive map visuals by default. To remove it, unselect Add Heatmap Layer, and click Apply.
Note that after you disable the Heatmap layer option, Google map renders only with the Cluster layer option, the other default.
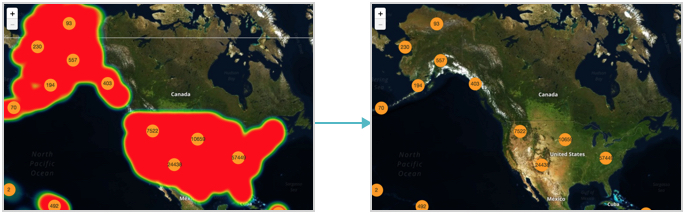
Similarly, the Mapbox map renders without the Heatmap layer option.
-
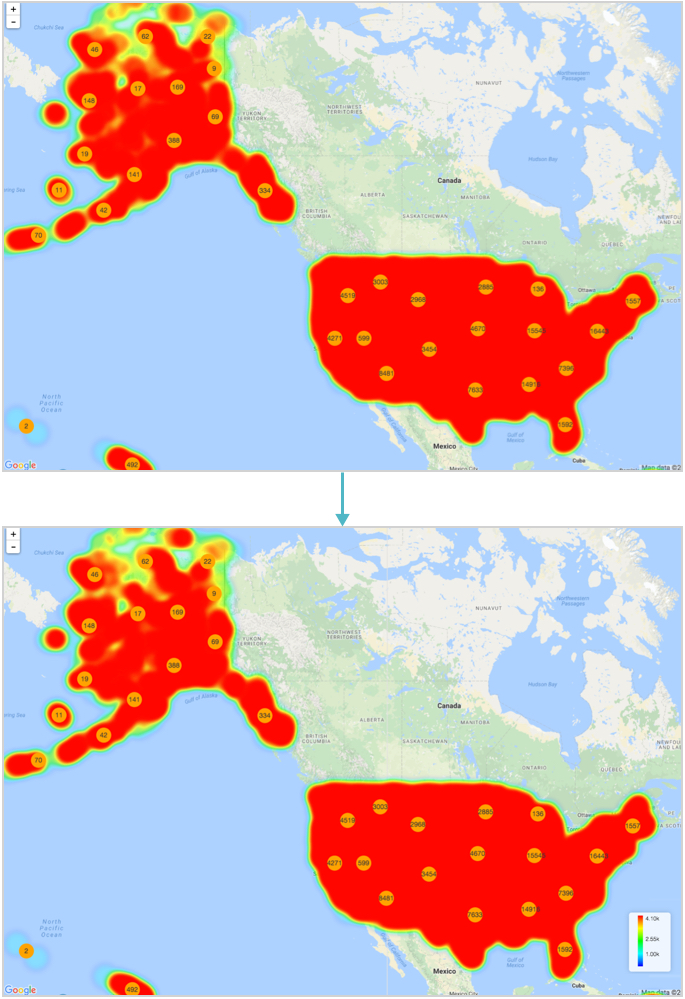
To show the legend for the heatmap, select Add Heatmap Legend under the Heatmap Layer Options, and click Apply.
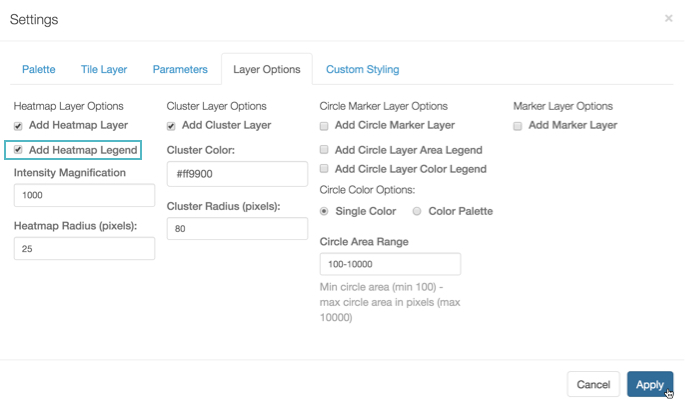
Note that after you enable the legend option, the legend appears in the lower right-corner of the Google map.
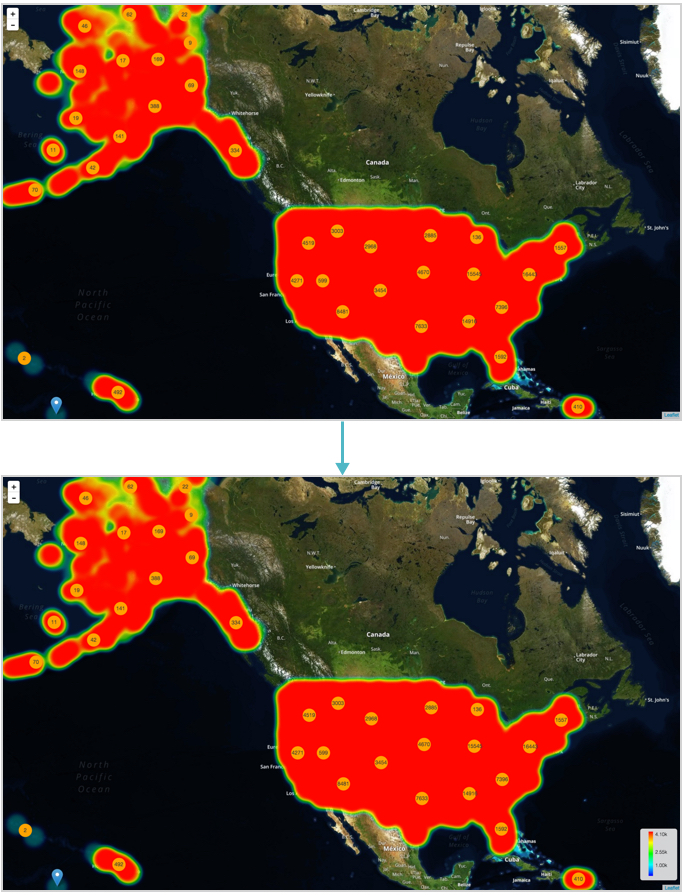
Similarly, the legend appears on the Mapbox map.
-
To adjust the intensity magnification of the heatmap, select change the value under Intensity Magnification, and click Apply.
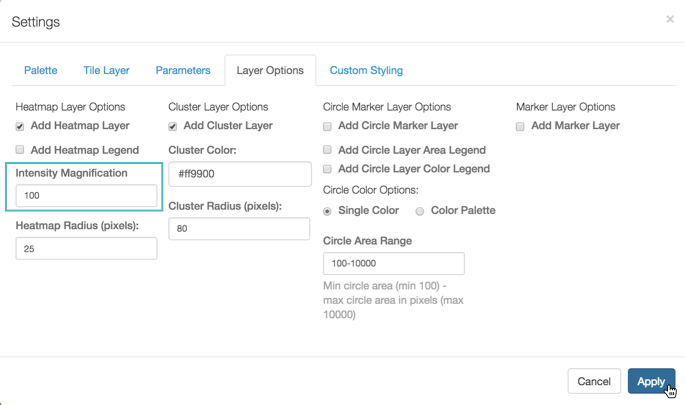
The default intensity magnification value is
1000. Compare the results of setting intensity magnification on Google Map to10,100,1,000, and10,000. In the following figures, the heatmap radius for all cases is25.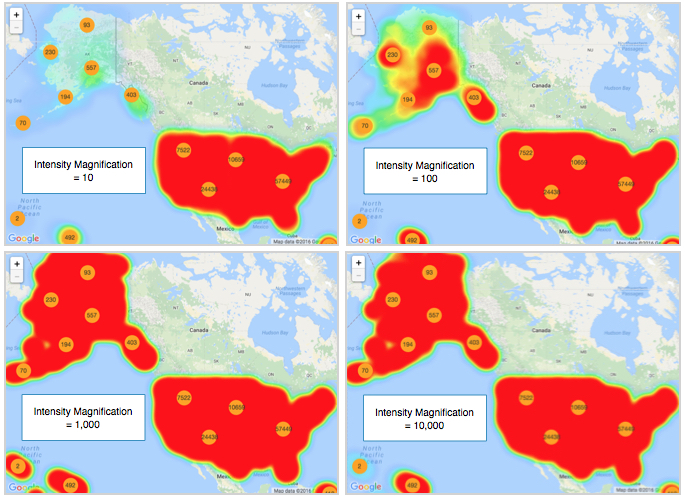
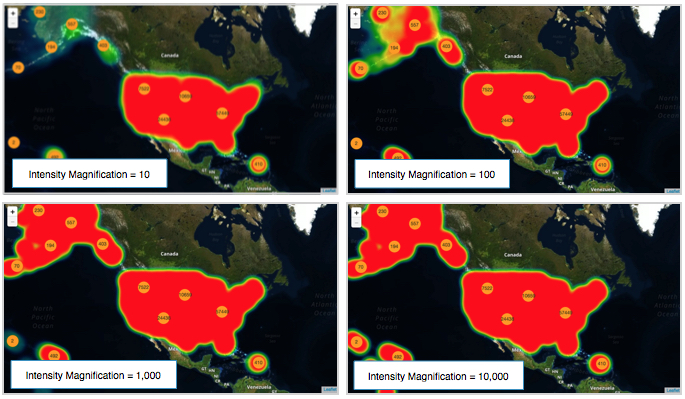
Similarly, compare the effect of the same heat intensity magnification settings on the Mapbox map.
-
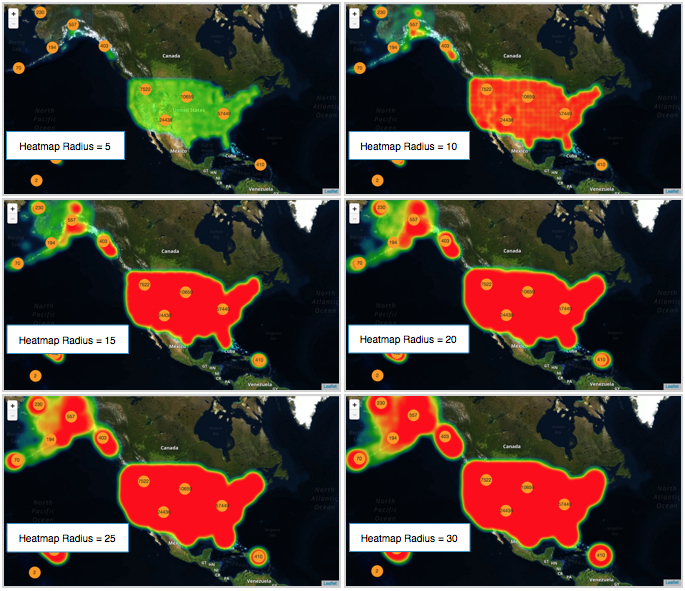
To adjust the Heatmap Radius, change the value under Heatmap Radius, and click Apply.
The default value of heatmap radius is
25. Compare the results of setting heatmap radius on Google Map to5,10,15,20,25, and30. In the following figure, the intensity magnification for all cases is100.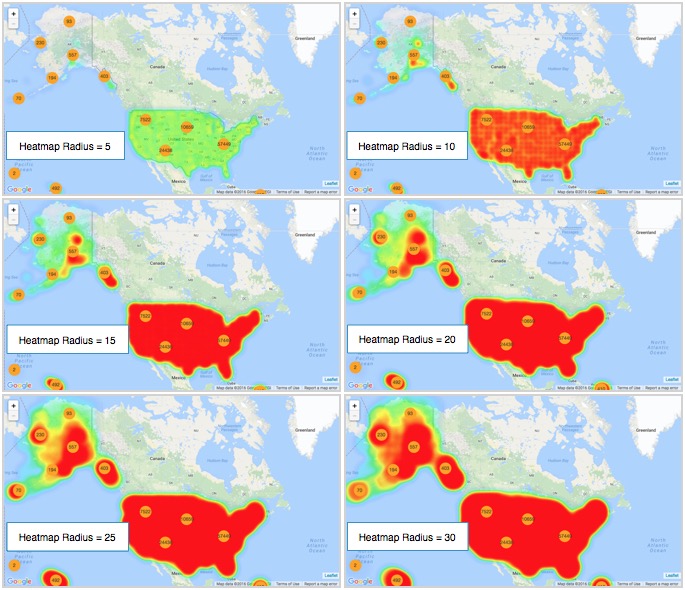
Similarly, compare the effect of the same heat intensity magnification settings on the Mapbox map.