Creating Visuals with Variable Dimensions
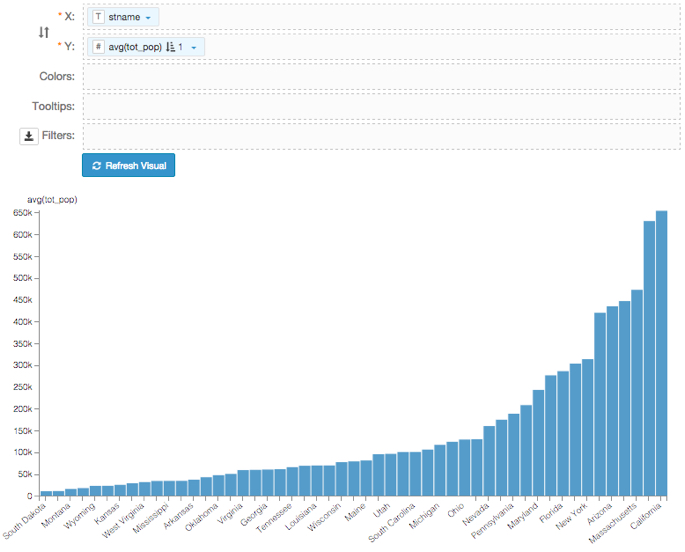
- Open a new visual based on US County Population dataset.
- Choose the bar chart visual type.
Populate the shelves of the visual:
- From Dimension, select and move
stnamefield onto the X shelf. - From Measures, select and move
tot_popfield onto the Y shelf. - On the Y shelf, select
tot_popfield, chose the Aggregates menu, and change the aggregate from Sum to Average. - On the Y shelf, select
tot_popfield, chose the Order menu, and select Ascending. - Click Refresh Visual.
- From Dimension, select and move
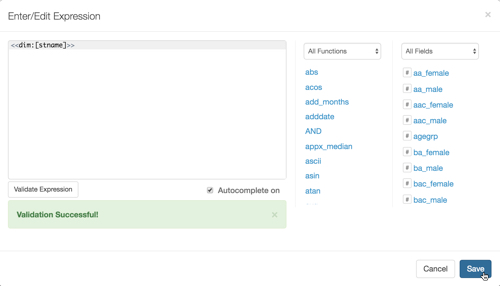
- On the X shelf, select
stnamefield, and then select Enter/Edit Expression menu. In the Enter/Edit Expression modal window,
- Change the text to the following expression:
<<dim:[stname]>>. - Click Validate Expression.
- After successful validation, click Save.
- Change the text to the following expression:
- Click Refresh Visual.
Change the name of the visual to Average population by <<dim>>.
Note that in this case, to have a nice title in your application, you must add the
<<dim>>parameter to the title of the visual; it is used by the filters you are defining next.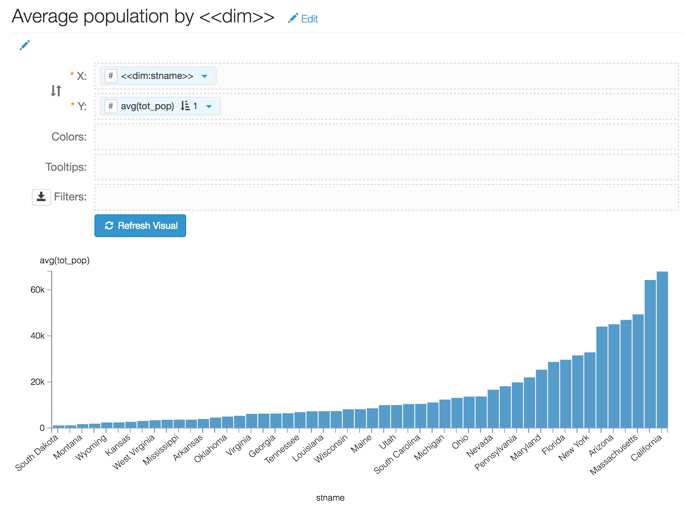
- Click Save.