Date and Time Functions
Arcadia has several built-in transformations for date and time that can be applied before rendering visual charts.
To use a date and time functions, follow these steps.
When creating or editing a visual, determine for which field variable you must adjust date or time presentation.
The shelves that support date and time functions depend on the visual type, and are typically available for X and Y axes, Measures, Dimensions, Colors, and Tooltips.
Click the icon to the right of the variable.

- In the dropdown, click Date/Time Functions.
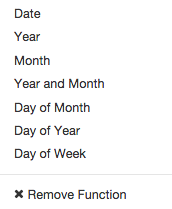
From the Date/Time Functions menu, select one of the following options:
Datereturns the value ofto_date([field]).Yearreturns the value ofyear([field]).Monthreturns the value ofmonth([field]).Year and Month Countreturns the value of the following expression:concat(cast(year([field]) as string), '-', if(month([field]) < 10, '0', ''), cast(month([field]) as string)) as 'month of year'
Day of Monthreturns the value ofdayofmonth([field]).Day of Yearreturns the value ofdayofyear([field]).Day of Weekreturns the value ofdayofweek([field]).Remove Functionremoves all of the above.
- Click Refresh Visual.