Using Dimension Hierarchies
Dimension hierarchies enable you to create complete visualizations with powerful drill down capability within a single visual, instead of relying on a complex interaction of two or more visuals inside an app.
Dimension hierarchies can be used with bar, line, area, and grouped bar visual types.
Starting with ArcViz Release 3.2, we provide an alternate solution for hierarchical dimension representation in cross-tab visuals.
The following steps demonstrate how to use Region, a dimensional hierarchy based on dataset World Life Expectancy [data source samples.world_life_expectancy], to build a bar chart that can switch between representations at three different levels of data granularity. To create this hierarchy, see Creating New Dimension Hierarchies.
Start a new bar visual on the World Life Expectancy dataset.
See Bar Visuals.
-
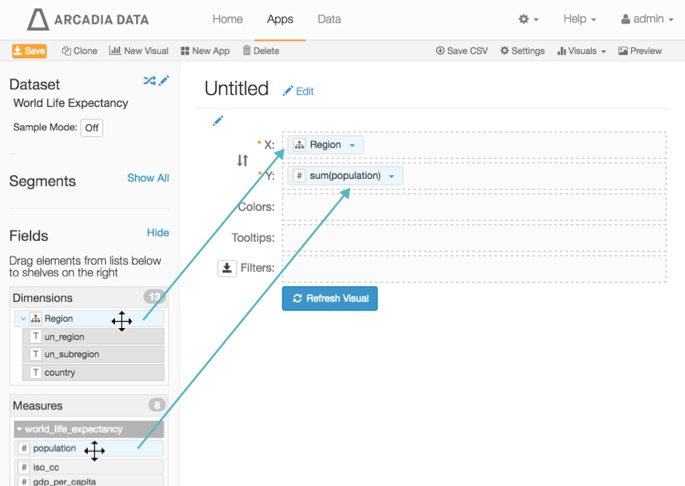
Populate the shelves of the visual:
- Under Dimensions, scroll downwards until you see the hierarchy
Region. SelectRegionand drag it over X shelf on the main part of the screen. Drop to add it to the shelf. - Under Measures, select
populationand drag it over Y shelf on the main part of the screen. Drop to add it to the shelf.
Building a Bar Chart with Hierarchies - Under Dimensions, scroll downwards until you see the hierarchy
-
Click Refresh Visual.
The bar chart appears.
Note that the legend along the X axis corresponds to the top level of the
Regionhierarchy,un_region.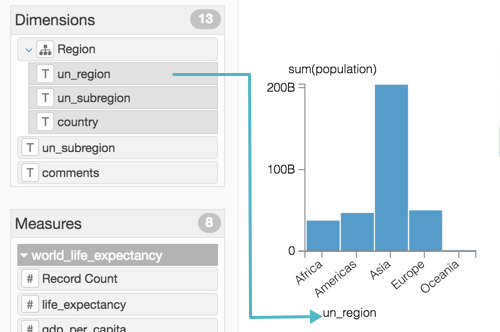
Bar Chart with a Hierarchy, at Top Level -
Change the title to
World Population - Hierarchy. Above the left navigation bar, click Save.

-
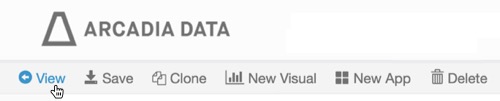
Switch to view mode to examine the operation of the dimensional hierarchy in the visual.
-
Put the pointer over one of the data labels along the horizontal axis, and note that it change color; this is because the data labels are link-enabled. Click on one of the choices to drill down to a lower level of the hierarchy.
In the following graphic, we drilled down from Level 1:
un_region = 'Africa', to Level 2:un_subregion = 'Western Africa', and then to Level 3:country.Note that every time you move between the hierarchy levels, the scale of the vertical axis adjusts automatically.
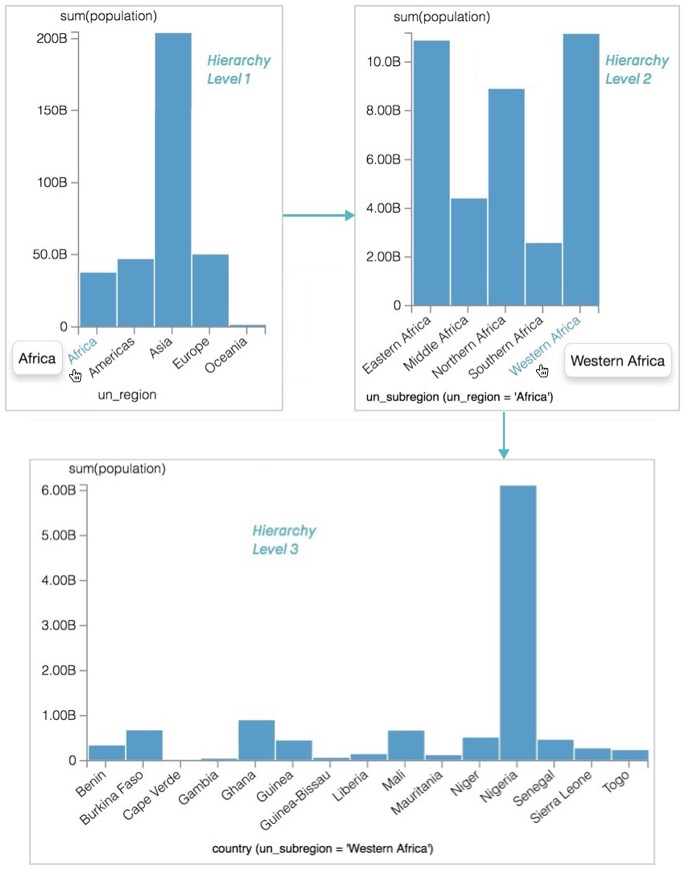
Drilling Down the Dimensional Hierarchy Levels -
Similarly, put the pointer over the label of the horizontal axis, and note that it change color; it is also link-enabled. Click the horizontal axis label to go up the hierarchy levels.
In the following graphic, we moved from Level 3:
countrywhereun_region = 'Africa'andun_subregion = 'Western Africa'to Level 2:un_subregion = 'Western Africa'whereun_region = 'Africa', and then to Level 1:un_region.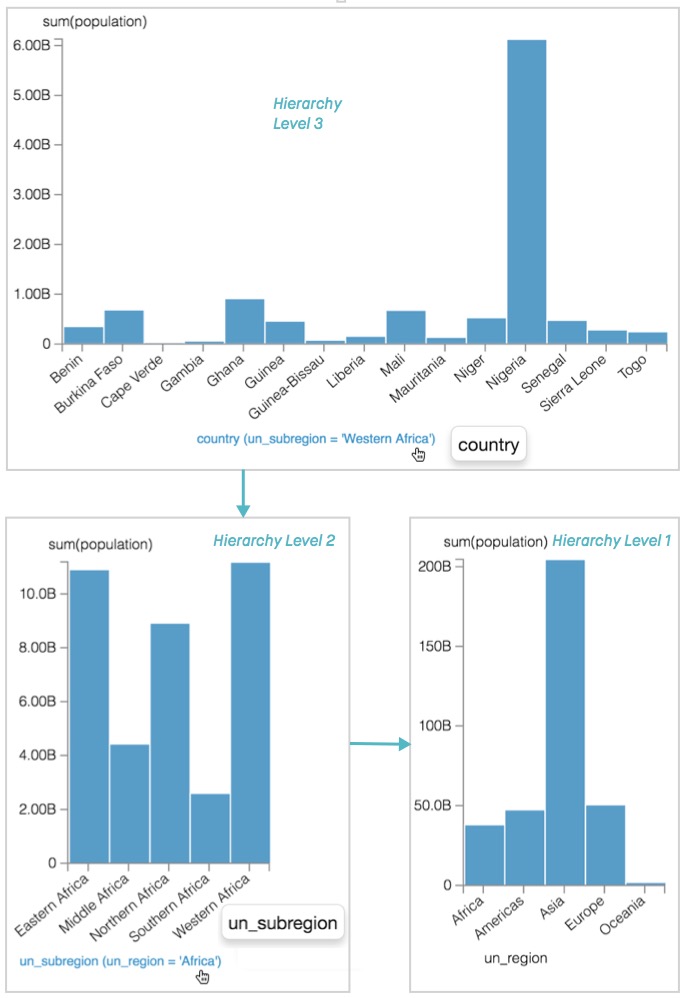
Moving Up the Dimensional Hierarchy Levels