Currency Display Formats
The following steps demonstrate how to adjust the display format for currency, using the Currency category. For very large numbers, we include the Custom category options that relate to currency quantity representations.
We are using the Capital Expenditure by Industry dataset, based on datafile annual-capital-expenditure-industry.csv. Remember that currency magnitudes use words, such as thousands (103), millions (106), billions (109), trillions (1012), and so on. In contrast, Scientific Notation uses prefixes: k: kilo- (103), M: Mega- (106), G: Giga- (109), T: Tera- (1012), and so on. See the Quantity Format reference.
The following steps demonstrate how to adjust the display format for currency, using the S format option. We are using the Capital Expenditure by Industry dataset, based on datafile annual-capital-expenditure-industry.csv. Remember that currency magnitudes use words, such as thousands (103), millions (106), billions (109), trillions (1012), and so on. In contrast, Scientific Notation uses prefixes: k: kilo- (103), M: Mega- (106), G: Giga- (109), T: Tera- (1012), and so on. See the Quantity Format reference.
- Create a new visual in the dataset Capital Expenditure by Industry.
- Choose the bars chart type, and place the
industryfield on the X shelf, andexpenditurefield on the Y shelf. - Click the icon to the right of the
expenditure field. - In the dropdown, click Display Format.
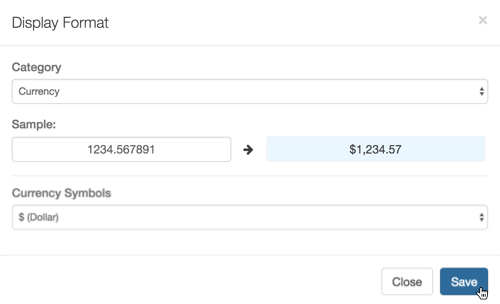
In the Enter Display Format modal window,
Under Category, select Currency.
Notice that this action adds a Currency Symbols option.
- [Optional] Under Sample, enter a representative value, to preview the formatting changes.
- Under Currency Symbols, select $ (Dollar).
- Click Save.
Click Refresh Visual.
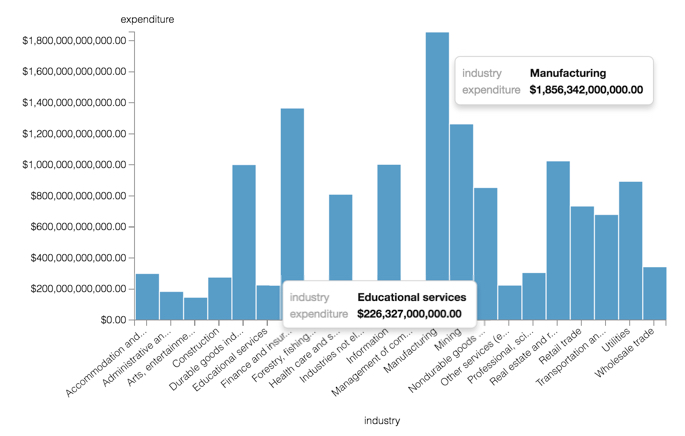
Notice that the standard number form is inadequate for clearly representing very large numbers.
Again, click the icon to the right of the
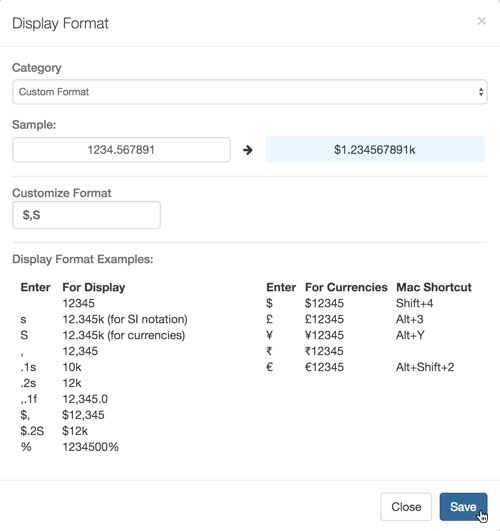
expenditure field, and select Display Format from the dropdown.In the Enter Display Format modal window,
-
Under Category, select Custom.
Notice that this action adds a Customize Format option, and a set of Display Format Examples.
- Under Customize Format, enter $,S.
- Click Save.
-
-
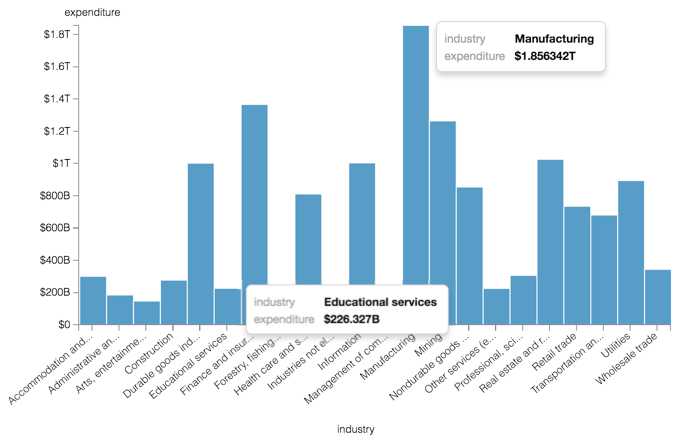
Click Refresh Visual.
-
Notice that the new display format more clearly categorizes the magnitude of the currency, with Educational Services expenditure valued at approximately $226 Billion, contrasting with Manufacturing at nearly $2 Trillion, for the years covered by the data.
- Name and Save the visual.
[Optional] You can see how the data format appears across the data set by creating an app that contains both this bar chart and a table visual.
- Clone the visual and change the chart type to table.
- Name and Save that visual.
- Click New App, and add both visuals to it.
- Name and Save the app.
Note that some column values have the suffix B (billions), while larger columns have the suffix T (trillions).
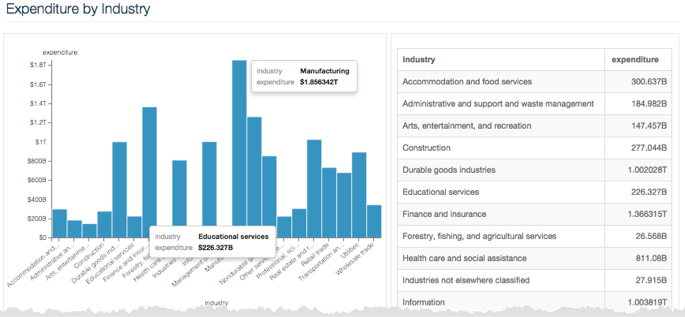
Note that the visual's display has the specified format, the comma thousands separator.