Understanding the Statistical View of the Activity Log
To see a statistical view of the activity log, click the Show Stats option at the top left of the Activity Log interface.
Note that when you switch to this view, the traditional list view still appears on the interface, visible if you scroll downwards in the browser window.
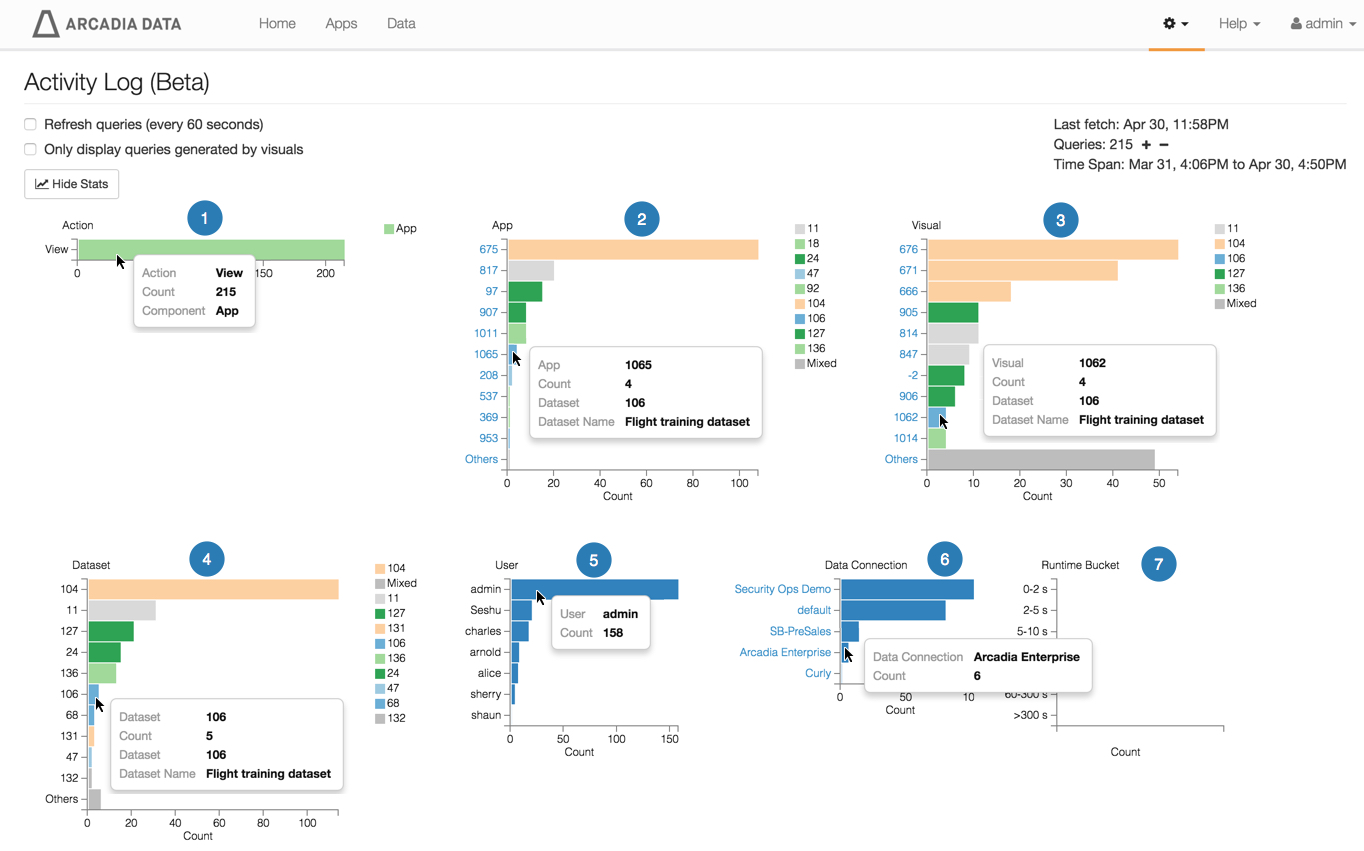
In the list version of the Activity Log interface, note that statistics are reported as horizontal bar charts:
- Action breaks down the requests by type, such as View.
App shows the most frequently accessed apps.
Note that they are listed by id that is linked to the individual app.
Also, the legend on the graph shows the ids of the datasets where the requests ran.
Visual shows the most frequently accessed visuals.
They are listed by id that is linked to the individual visual.
- Dataset shows the most frequently accessed datasets.
- User reports the accounts that issued the requests.
- Data Connection reports the most frequently used connections.
- Runtime Bucket shows the run times of requests.