Bar Size

Applies to Bar charts and Combined Bar/Line charts.

To increase or decrease the size of bars in bar charts,

  1. Click Settings on the right side of the Visuals menu.

    selecting visual settings menu

    The Settings modal window appears.

  2. In the Settings modal window, click Marks.
  3. Adjust Bar size range.

    Settings modal for bar chart, open on Marks tab; checkbox for 'Show Legend', checkbox for 'Display linear trendline', textbox for 'Separate trendlines by color', textbox for 'Decimals included when displaying the trendline equation and r-square value' set to '3', checkbox 'Colors are based on dimension values' (active), textbox 'Bar size range' set to '6-30', Cancel button, and Apply button (active)
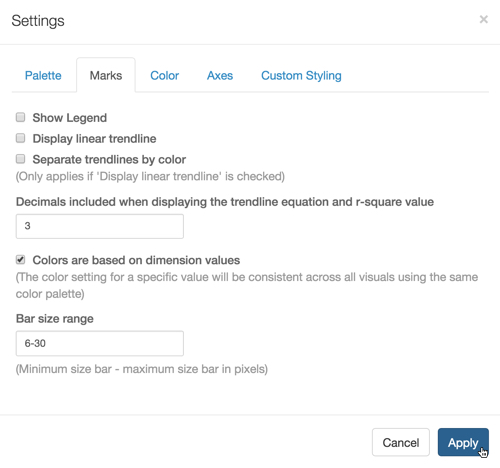
    Adjusting Bar Size Range for a Bar Graph; Settings Marks
  4. Click Apply.

  5. Click Refresh Visual.

  6. Compare the relative widths of the bars in the following two graphs. Note that the wider setting allows enough space to label each bar element.

    Two charts showing the same global population data, with sum(population on Y axis, and year on X axis. Left bar graph with Bar Size Range 6-30, right bar graph with Bar Size Range 6-10
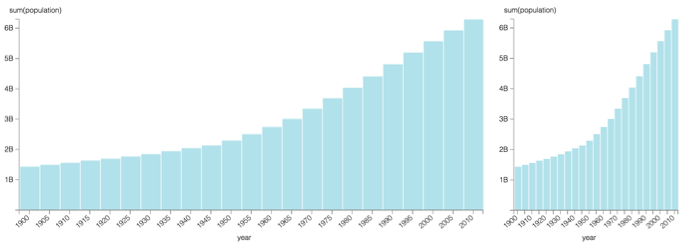
    Comparing Bar Charts with Width 6-30 (on the left) and Width 6-10 (on the right)