Marks as Bubbles
Applies to Maps.
Map visuals, except when plotting data for the latitude/longitude or zipcode dimensions, default to the choropleth map option. To display bubbles instead,
-
Click Settings on the right side of the Visuals menu.
The Settings modal window appears.
- In the Settings modal window, click Marks.
-
Check Always display marks as bubbles.
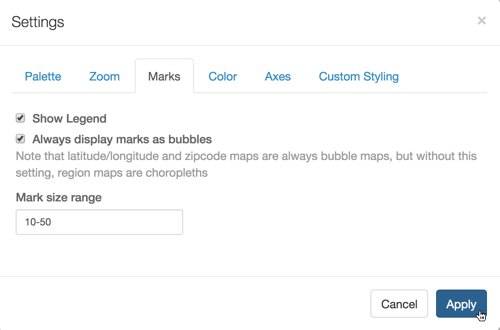
Showing Data as Bubbles on a Map; Settings Marks Click Apply.
Click Refresh Visual.
-
Compare the appearance of world map as a choropleth map, and as a map with bubble marks.
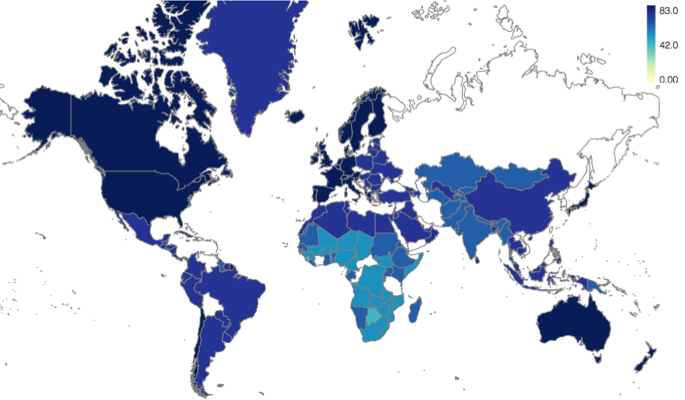
World Life Expectancy, as a Choropleth Map 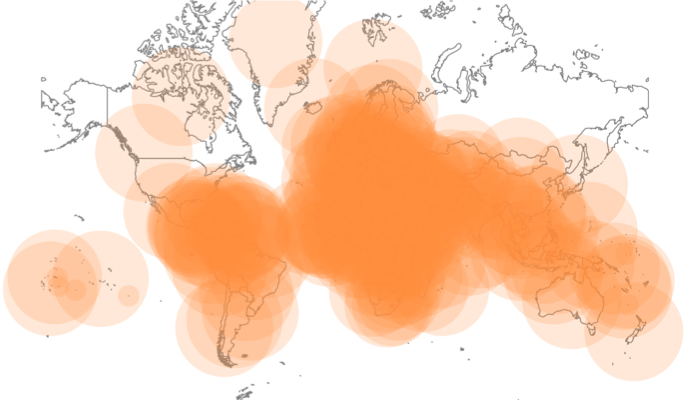
World Life Expectancy, as a Map with Bubble Marks