Making Colors Consistent on Dimension Values
This feature applies to Bar visuals, Line visuals, Area visuals, Combined Bar/Line visuals, and Pie visuals.
In apps where several visuals include same dimension values, it is helpful if these values are colored identically. It also removes the need for multiple legends on the same app.
For this feature to work properly, you must ensure that the target visuals use the same color palette.
In the following example, we show how to standardize colors for a US State Population app that uses a bar visual and a trellised line visual.
You must perform these steps for each visual in the app.
- Open the visuals in Edit mode.
-
Click Settings on the right side of the Visuals menu.
The Settings modal window appears.
- In the Settings modal window, click Color.
-
Select Colors are based on dimension values.
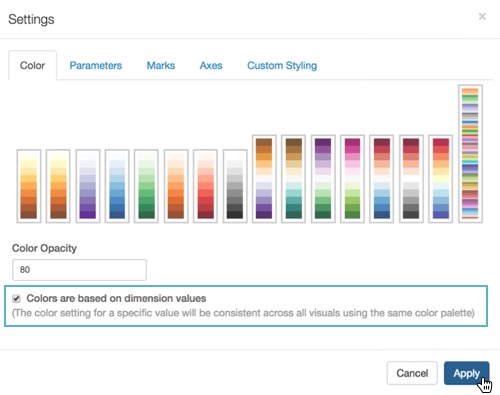
Ensuring Colors are Based on Dimension Values; Settings Color - Still in the Color tab, select the same palette for all visuals.
Click Apply.
Click Refresh Visual.
- After completing all the changes, examine the app that uses them.
-
Compare the color values for the two visual in the top graph. It can be easily seen that the legends for the visuals don't match in the top app, but are identical in the bottom app where we enabled the color consistency feature.
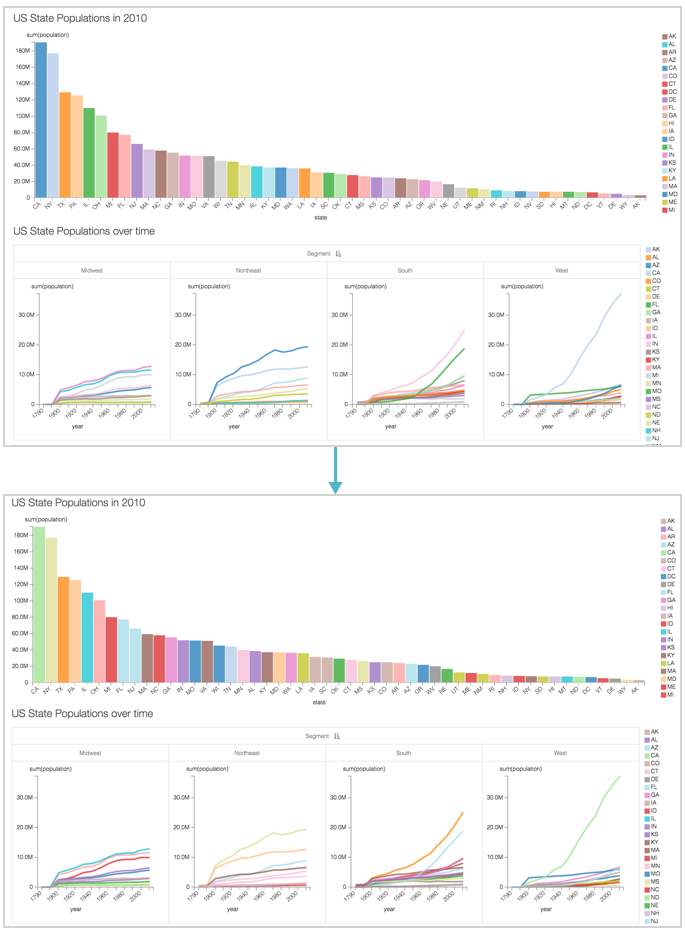
Enabling Same Color on Dimension Values in an App