Data Points
Applies to Line charts, Area charts, and Combined Bar/Line charts.
To show the individual data points on a line,
-
Click Settings on the right side of the Visuals menu.
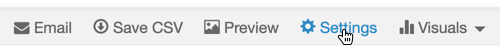
The Settings modal window appears.
- In the Settings modal window, click Marks.
Select Show Points.
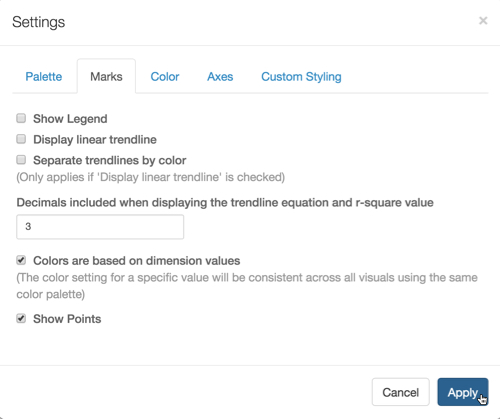
Showing Points for Line Graph; Settings Marks Click Apply.
Click Refresh Visual.
Note that the points appear on the visual.
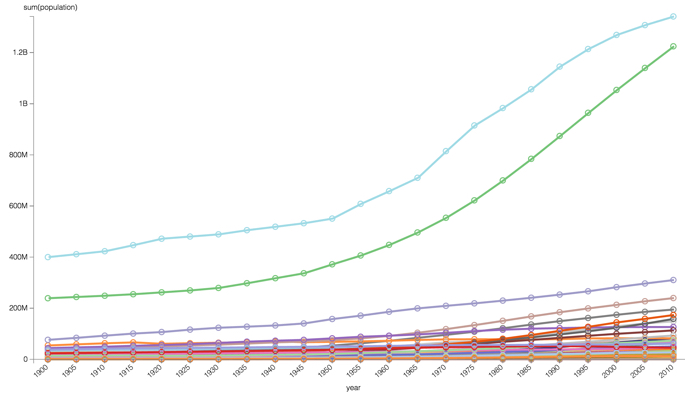
Line Chart with Points Showing