Convert Line to Area Visual
Applies to Combined Bar/Line charts.
By default, combined charts show one dimension as bars, and the second dimension as a line. The second option can be specified as an area chart, instead.
To make this change,
-
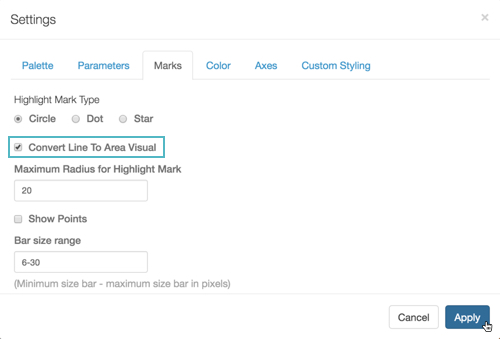
Click Settings on the right side of the Visuals menu.

The Settings modal window appears.
- In the Settings modal window, click Marks.
-
Select Convert Line to Area Visual, and click Apply.
Changing from Line to Area Visual - Click Refresh Visual.
Click Apply.
Click Refresh Visual.
-
Notice that the chart changed from bar/line to bar/area.
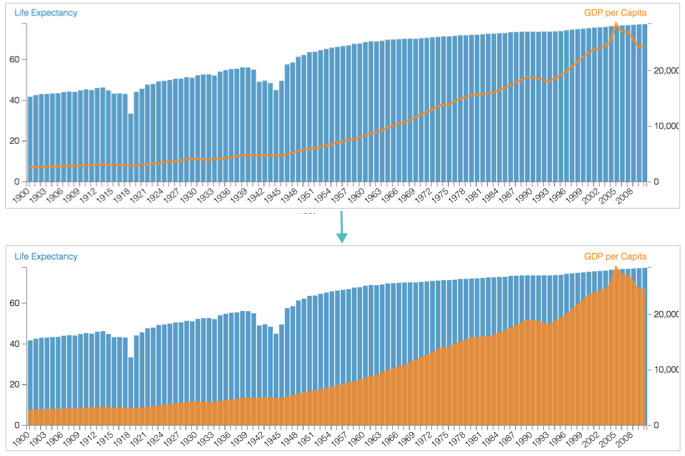
Contrast Combined Bar/Line and Bar/Area Visuals