Trellis Option with Independent Scale
Trellis charts are very powerful visualization tools. However, they don't work well when one data partition contains values that are several orders of magnitude larger than in the other data partitions. The charts that represent segments with smaller values are very difficult to interpret. You can mitigate this problem by enabling independent aggregate scale.
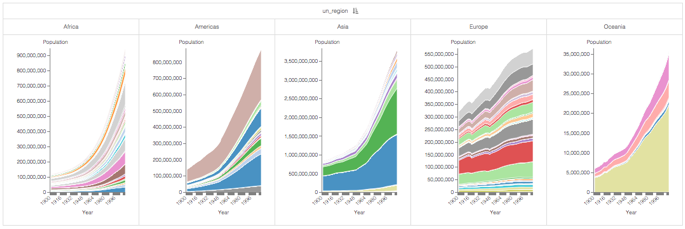
The following steps demonstrate how to create a new trellised area chart with independent aggregate axes on dataset World Life Expectancy [data source samples.world_life_expectancy].
If you have not done so yet, create World Population - Area visual, described in Area Visuals, followed by World Population - Area Trellis, from Enabling the Trellis Option.
Find and select World Population - Area Trellis visual, and open it in the editing mode.
Clone the visual, as described in Cloning Visuals.
Notice that while the chart for Asia shows clear growth, the one of Oceania does not show any color.
This is because by default, trellis charts are generated to the same scale. You should set Oceania to its own scale to be visible.
Arcadia Data provides an override to this default setting. You have an option to set the trellis charts to their own axes by customizing the axes, and selecting Independent Aggregate Scale option, as described in Customizing Axes.
Click Refresh Visual.
The updated trellised area chart appears.
Click Edit next to the title of the visualization.

Change the title to
World Population - Area Trellis, Independent Axes.Above the left navigation bar, click Save.