Filtering by Year; Bar Visuals Example
When working with a very large set of data, it is necessary to quickly access and examine a specific subset of information. Arcadia Enterprise gives you the ability to filter information on all fields of the dataset. This example shows how to use such a filter to limit the result set and visualization to one year.
Tip. This demonstration uses the visual previously created in Bar Visuals.
To use this visual to see the bar chart for a specific year, such as 2010, follow these steps.
On the Filters shelf, click
year, then click Pick values from a list.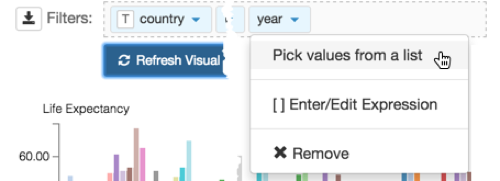
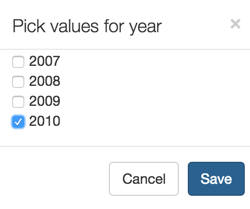
In the Pick values for a year modal window, select 2010, then click Save.
- Click Refresh Visual.
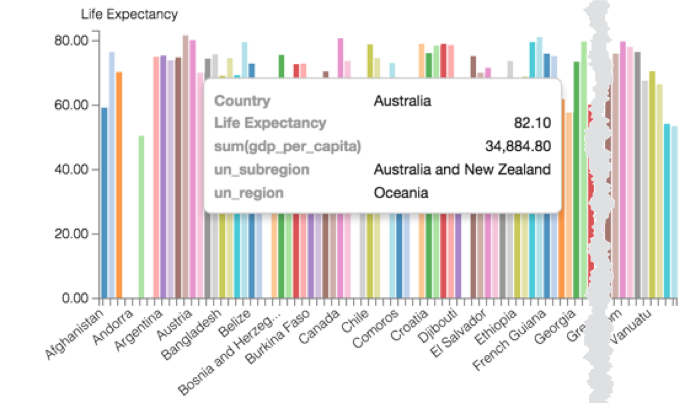
Note how the line changed compared to the previous display (averaged over 1900 - 2010 span).
If you hover the mouse over the graph, you can see the tooltip text.