US Zip Code Map with Bubbles
A zip code map of the United States shows a comparison of measurement values across US States.
This article uses data that is not included with Arcadia Enterprise. Follow these steps to add it to your application.
- Download the datafile hud-zip-county-122010.csv.
- Import this data into Arcadia Enterprise.
- Create dataset
HUD Residential/Business Ratios.
- Remember that to map zip code information, the dimension must be named
zipcode. This article demonstrates how to use the Alias setting to make the dataset fieldzipconform to this requirement.
The following steps demonstrate how to plot the proportion of buildings that are designated for residential use at the level of zip code, across the territory of US. It uses a custom dataset HUD Residential/Business Ratios [data source samples.hud_zip_county_122010], and produces a map with bubble marks that correspond to the relative size of the measurement for each zipcode field.
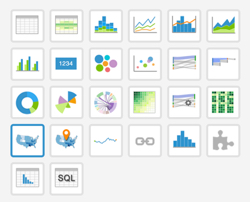
- Start a new visual based on dataset
HUD Residential/Business Ratios[data sourcesamples.hud_zip_county_122010]; see Creating Visuals. In the visuals menu, find and click map, the sixth choice on the third row.
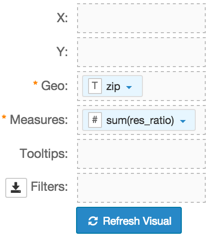
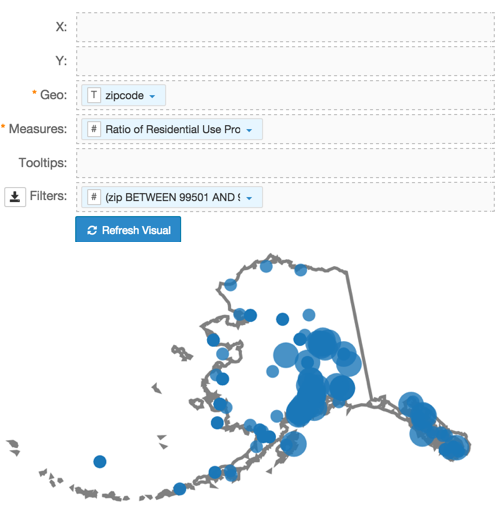
Note that the shelves of the visual changed. They are now X, Y, Geo, Measures, Tooltips, and Filters.
The mandatory shelves for map visuals are Geo and Measures.
Populate the shelves from the available fields (Dimensions, Measures, and so on) listed in the left navigation menu.
- Under Dimensions, select
zipand drag it over the Geo shelf on the main part of the screen. Drop to add it to the shelf. - Under Measures, select
res_ratioand drag it over the Measures shelf on the main part of the screen. Drop to add it to the shelf.
- Under Dimensions, select
- If you click Refresh Visual at this time, it generates an error.
On the shelf, on
sum(res_ratio)field, click the icon (down arrow), select Aggregates, and then select Remove Aggregate.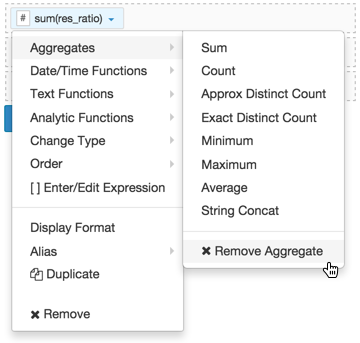
Note that the shelf now contains the modified field
res_ratio.
- Alias the field
zipaszipcode, andres_ratioasRatio of Residential Use Properties. - Under Dimensions, select
zipand drag it over the Filters shelf on the main part of the screen. Drop to add it to the shelf. - On the Filters shelf, click the icon (down arrow) on the
zipfield, and select Enter/Edit Expression. In the Enter/Edit Expression modal window,
- Enter the range of values that represent zip codes for the state of Alaska:
([zip] BETWEEN 99501 AND 99950)
- Click Validate Expression.
- Click Save.
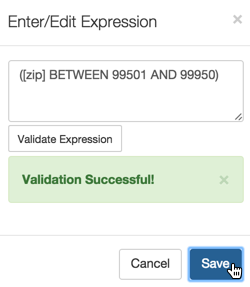
- Enter the range of values that represent zip codes for the state of Alaska:
- Turn on the Enable pan and zoom and Zoom to active area options, as described in Customizing Zoom.
- Change the size of the bubbles to the range
1-3, as described in Mark Size Range. Click Refresh Visual.
The map visual appears. You can adjust the size and focus of the visual to show the area of interest.
Click Edit next to the title of the visualization.
- Change the title to
US Residential Address Zipcode Map. Above the left navigation bar, click Save.