Specifying Filters in Visuals
To use application controls, first specify the relevant filters in the visuals.
In this demonstration, you will be working with the US Census dataset. You will add state and year field filters to two existing visuals, State Line Graph and State Table Data.
Open State Line Graph.
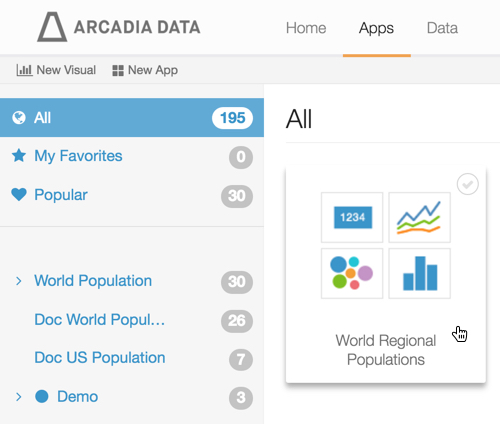
- In the main navigation bar, click Apps.
In the search bar, enter the name of the previously defined visual you wish to use.
Alternatively: in the left navigation bar, click All, then browse to find the previously saved visual.
-
Click the icon that represents the visual or the app.
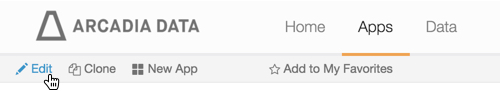
Click Edit in the top left corner, to edit the app.
In the State Line Graph visual edit mode, make the following changes:
- Select
statefrom Dimensions, and drag it onto the Filters shelf. - Select
yearfrom Measures, and drag it onto the Filters shelf.
- Select
In the top left corner of the screen, click Save to save State Line Graph.
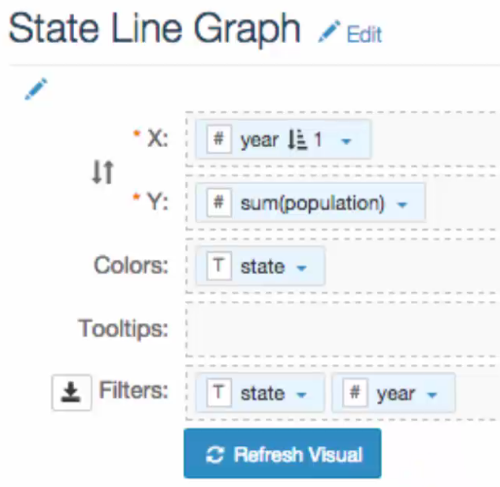
Set-up for 'State Line Graph' Visual Open State Table Data.
- In the main navigation bar, click Apps.
In the search bar, enter the name of the previously defined visual you wish to use.
Alternatively: in the left navigation bar, click All, then browse to find the previously saved visual.
-
Click the icon that represents the visual or the app.
Click Edit in the top left corner, to edit the app.
In the State Line Graph visual edit mode, make the following changes:
- Select
statefrom Dimensions, and drag it onto the Filters shelf. - Select
yearfrom Measures, and drag it onto the Filters shelf.
- Select
-
In the top left corner of the screen, click Save to save State Table Data.
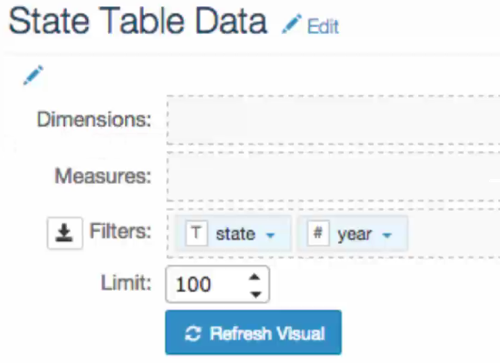
Set-up for 'State Table' Visual