Creating Application Filters that Control Optional Measures
- Open the previously created application World Regional Populations. It contains the visual Regional Populations.
- In left navigation, switch to Filters tab.
- Click Create Parameter to create a second filter.
- Hover over the new filter until the controls appear on the top right, and click the icon (gear).
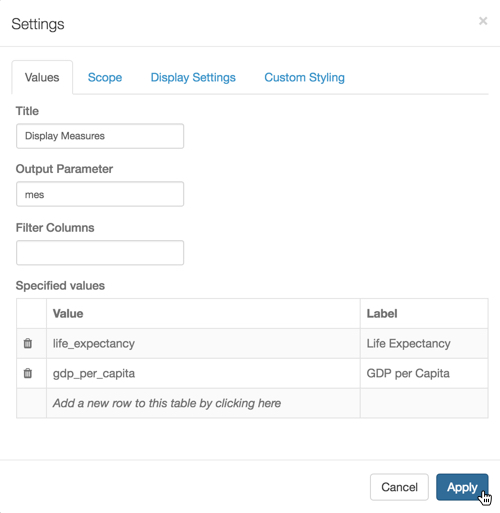
In the Settings modal window, switch to Values tab, and enter the following:
- Under Title, enter Display Measures.
Under Output Parameter, enter mes.
Note that this is the parameter from Creating Visuals with Optional Measures.
Under Specified values, enter the following two rows:
- Value:
life_expectancy, Label: Life Expectancy - Value:
gdp_per_capita, Label: GDP per Capita
- Value:
Configuring Values Settings for the Optional Measure -
In the Settings modal window, switch to Display Settings tab, and select options Permit only one item to be selected and In single select mode, include a 'No Selection' option.
Ensure that the other options are not checked.
Click Apply.
- Click Save in the upper left corner to preserve the changes to the application.
-
Switch to application viewing mode, and select World Regional Populations.
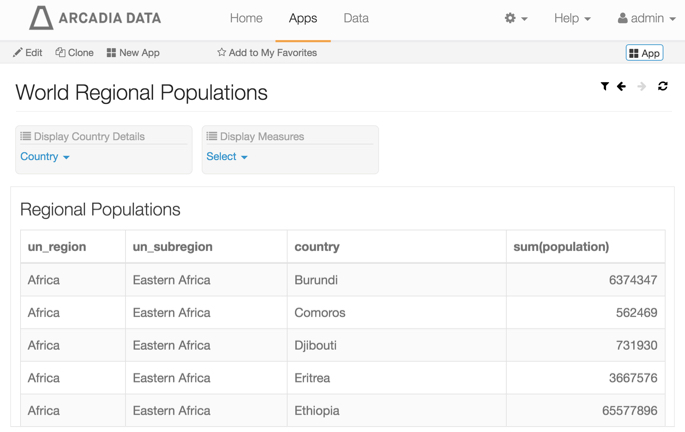
Application with Optional Dimension and Measures, at Runtime -
In the Display Measures filter, select Life Expectancy.
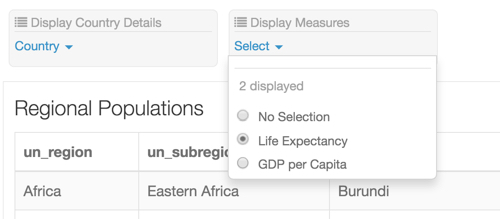
Choosing to Filter on 'Life Expectancy' Note that the table now has a new column, life_expectancy.
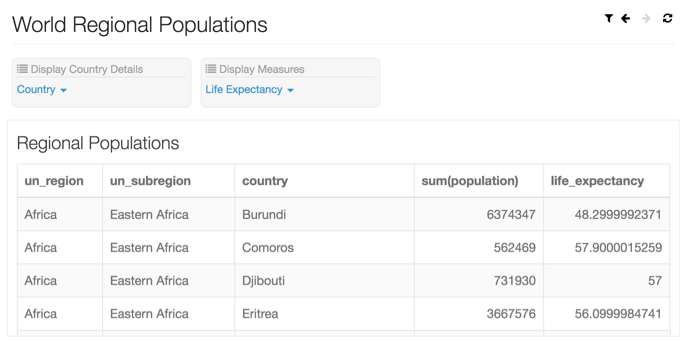
Optional Measure 'Life Expectancy' Included in Application -
In the Display Measures filter, select GDP per Capita.
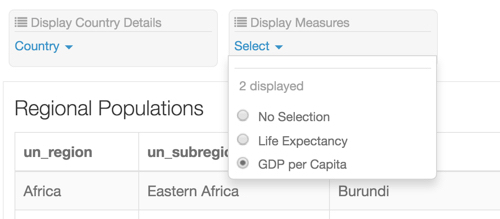
Choosing to Filter on 'GDP per Capita' Note that the additional column is now titled gdp_per_capita, not life_expectancy.
If you hover the pointer over the filter indicator at the top right corner of the application, you will see that there are two filter parameters:
dim: country, andmes: gdp_per_capita.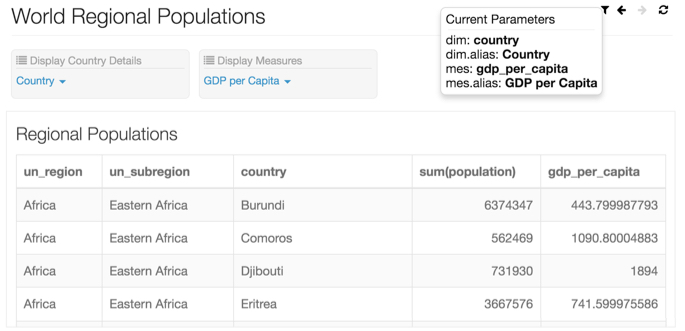
Optional Measure 'GDP per Capita' Included in Application - [Optional] You can easily navigate between the permutations of filter outputs you create by using filter navigation controls at the top right corner.