Using Connection Explorer
Arcadia Enterprise lets you see your existing data connections, and all data tables accessible through them. In Connection Explorer, you can preview the data and create new datasets for use in visualizations.
The following steps demonstrate how to use the Connection Explorer.
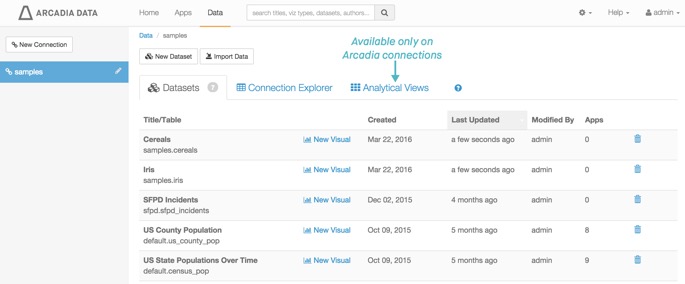
On the main navigation bar, click Data.
The Data view appears, open on the Datasets tab.
-
Note that the main area of the screen has two buttons: New Dataset and Import Data.
It also has two tabs: Datasets and Connection Explorer. Arcadia connections have an additional tab, Analytical Views. See the discussion on Architecture of Analytical Views.
List of Datasets on a Specific Connection - In the left navigation, select one of the existing connections; here, click on samples.
- In the main area, click the Connection Explorer tab.
-
The Connection Explorer view appears.
It shows that the connection samples has a single database, samples, and the list of tables stored on this database.
In addition to the New Dataset and Import Data buttons that appear on the Datasets tab, both Arcadia and Impala connections have a third button, Refresh, which forces a reload of the full table definition.
As mentioned earlier, Arcadia connections have an Analytical Views tab. See the discussion of Architecture of Analytical Views.
Each table has a New Dataset button for creating a new dataset, and its own Refresh button that forces a reload of the full table definition.
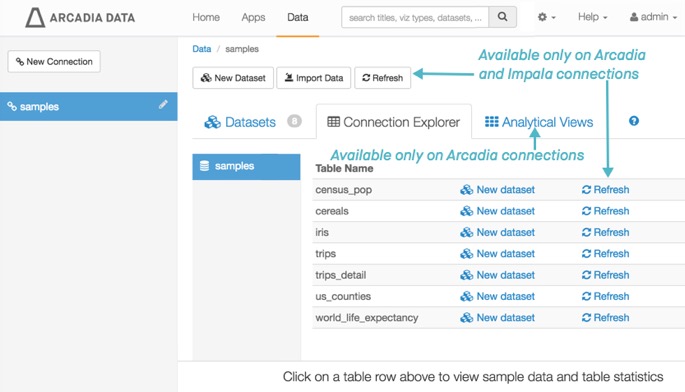
List of Source Tables on a Specific Connection -
Click on a table row to see a preview of the data stored in each table. Here, click on table
census_pop.Note that below the list of tables, a new Sample Data tab appears. It is a preview of data stored in
census_pop.[For Arcadia and Impala connections only] Click Refresh to force a table definition update.
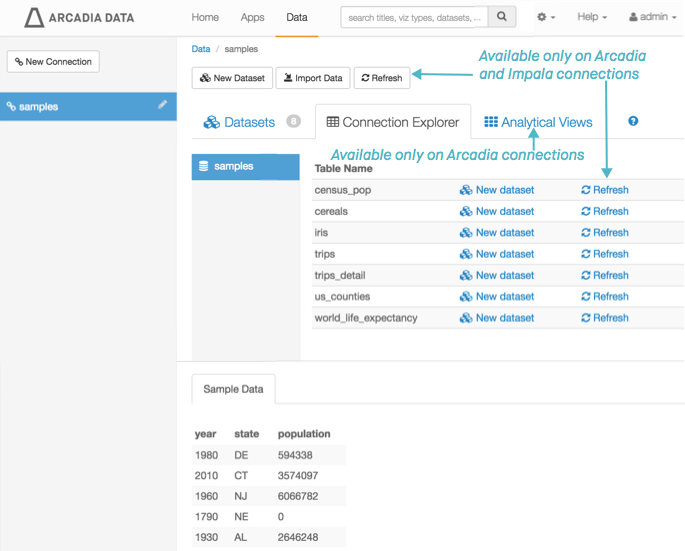
Previewing Data Tables in the Connection Explorer -
To create a new dataset, under the Table Name list, on the
census_popline, click New Dataset.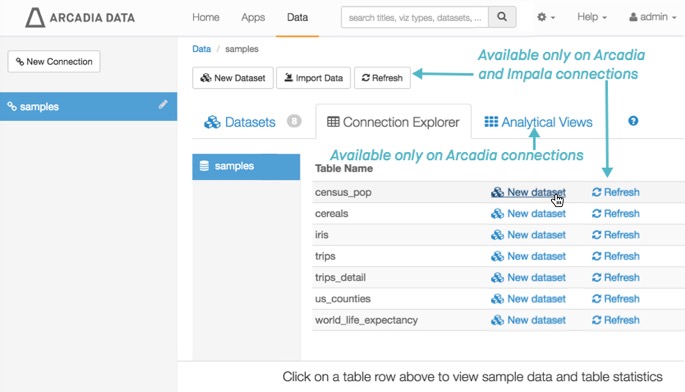
Creating a New Dataset in Connection Explorer -
In the New Dataset modal window, do the following:
-
Under Dataset title, enter the name of the new dataset.
Here, enter
NewUSCensusDataset. - Click Create.
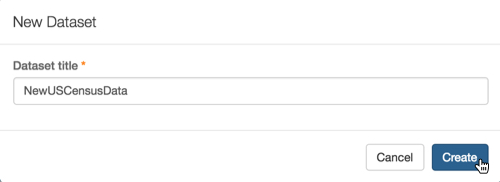
Naming the New Dataset -
-
Notice that successfully creating the new dataset returns the application to the Datasets tab.
The new dataset NewUSCensusData appears in the list of available datasets.
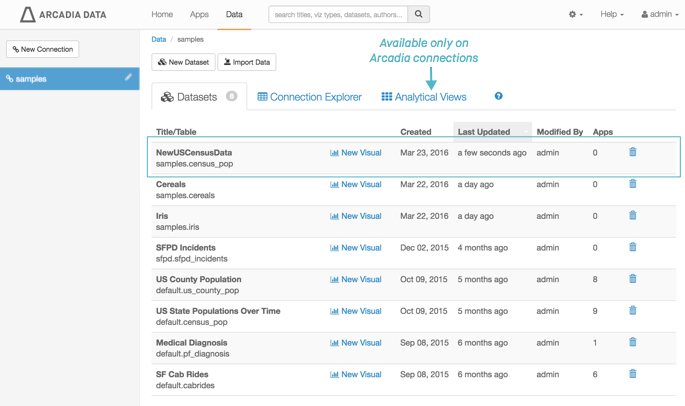
The New Dataset Appears in the List of Datasets