You may find it useful to define a hierarchy of dimensions, to enable visuals with variables levels of granularity over the same range of data.
The following steps demonstrate how to define such a hierarchy on the dataset World Life Expectancy [data source samples.world_life_expectancy]. We will use the dimensions un_region, un_subregion, and country to define a hierarchy called Region.
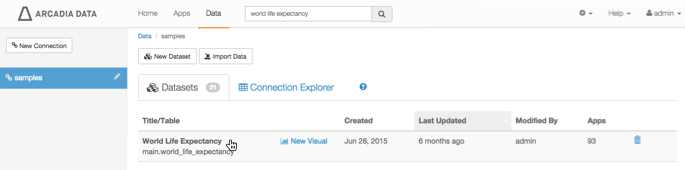
On the main navigation bar, click Data.
The Data view appears, open on the Datasets tab.
In the left navigation menu, click samples.
In the Datasets area, select World Life Expectancy(samples.world_life_expectancy).
Selecting Dataset 'World Life Expectancy'.
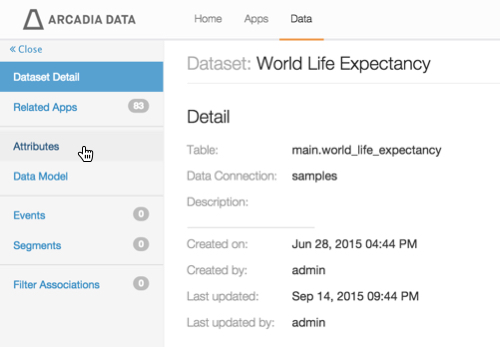
In the Dataset Detail menu, select Attributes.
Dataset Detail 'World Life Expectancy'
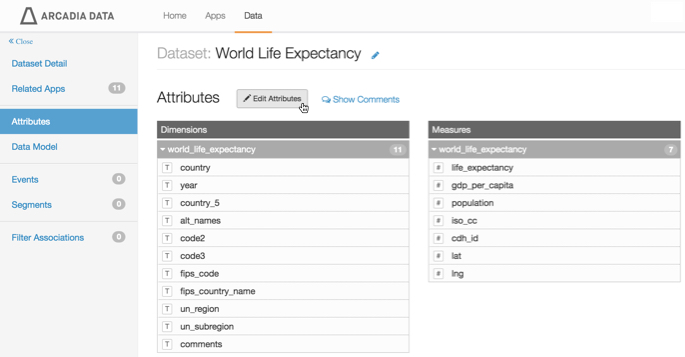
In the Attributes area, select Edit Attributes.
Editing the Attributes of Dataset 'World Life Expectancy'
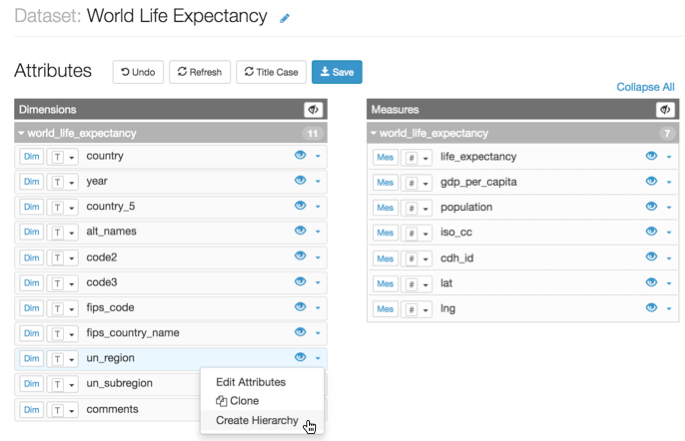
Under Dimensions, find the field un_region.
Click (down) icon on the un_region line, and select Create Hierarchy.
Starting Hierarchy Definition
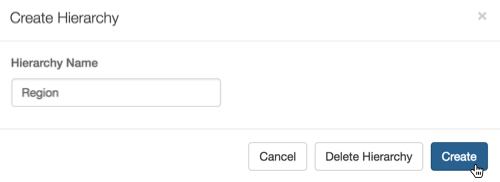
In the Create Hierarchy modal window, enter the Hierarchy Name, and click Create.
We named our hierarchy Region.
Creating the Hierarchy
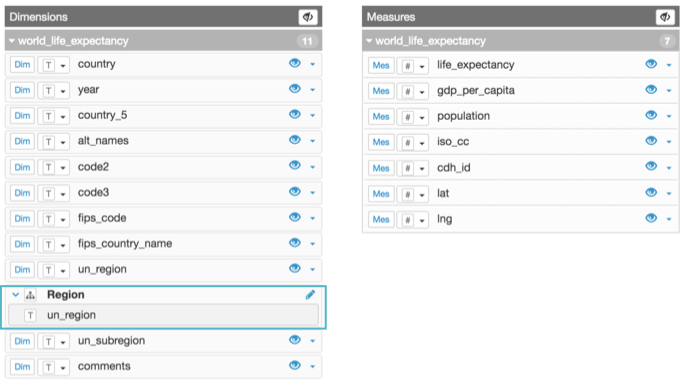
Note that Measures now contain a hierarchy Region, denoted by the (hierarchy) icon. The hierarchy contains a single element, un_region.
Hierarchy Appears on the list of Dimension Attributes
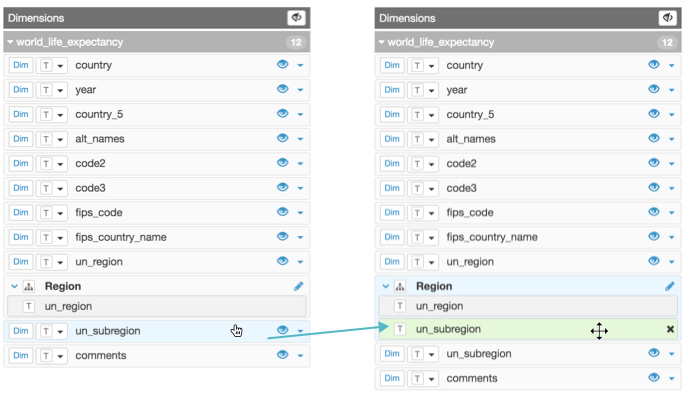
To add more levels to the hierarchy, simply click and drag the relevant dimensions or measures to the newly created hierarchy. Be sure to arrange them in order of scale, from largest to smallest.
Below un_region, we added un_subregion.
Adding a Second Level to the Hierarchy
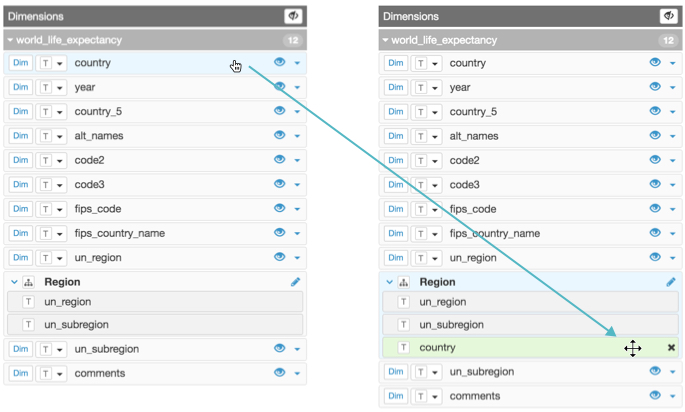
Below un_subregion, we added country.
Adding a Second Level to the Hierarchy
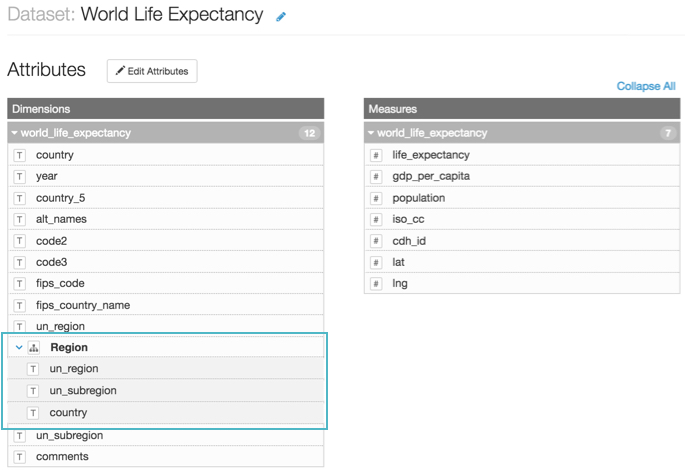
Click Save.
Note that the hierarchy Region appears alongside the dimensions obtained directly from the data table. It can be used on the shelves of visuals in the same manner as other dimensions.