Understanding the List View of the Activity Log
In the list version of the Activity Log interface, note the following features:
-
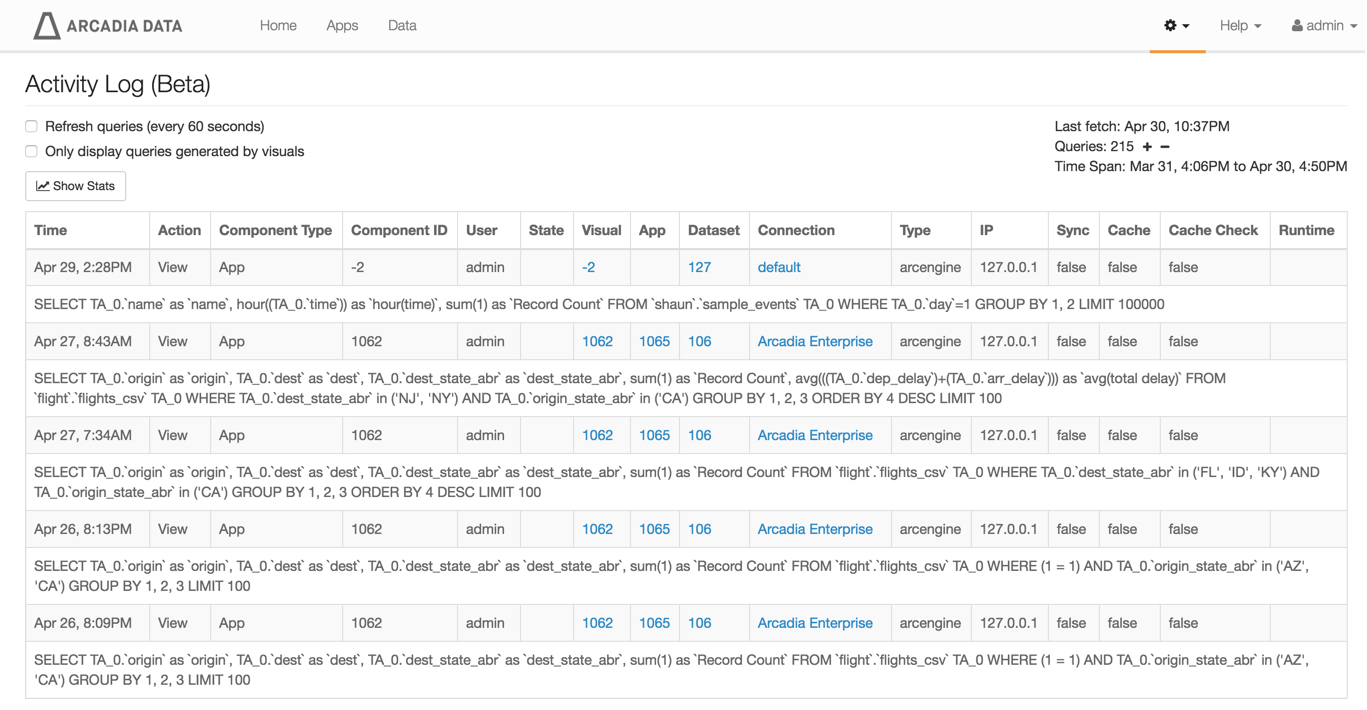
Each event lists the SQL query that creates the log entry, such as:
SELECT TA_0.`origin` as `origin`, TA_0.`dest` as `dest`, TA_0.`dest_state_abr` as `dest_state_abr`,
sum(1) as `Record Count`, avg(((TA_0.`dep_delay`)+(TA_0.`arr_delay`))) as `avg(total delay)` FROM
`flight`.`flights_csv` TA_0 WHERE TA_0.`dest_state_abr` in ('NJ', 'NY') AND TA_0.`origin_state_abr`
in ('CA') GROUP BY 1, 2, 3 ORDER BY 4 DESC LIMIT 100
Note that this field is scrollable for large blocks of SQL.
- Time of the event is a timestamp of when a query ran, such as Apr 27, 8:43AM.
- Action is the type of event that generated the activity, such as View.
- Component Type indicates the what interface within Arcadia was used to generate the activity, such as App.
- Component ID provides the id of the component that originated the action, such as 1062.
- User identifies the account that originated the action.
- State provides the information on the status of the query: if it is running, if it is inn error state, and so on.
Visual is a linked id of the visual that originated the action.
Clicking on this link opens a new browser window for the named visual.
-
[Optional] App is a linked id of the app that originated the action.
Clicking on this link opens a new browser window for the named app.
-
Dataset is a linked id of the dataset on which the action ran.
Clicking on this link opens a new browser window for the named dataset.
-
Connection is the name of the connection of the dataset where the action ran.
Clicking on this link opens a new browser window for the named connection, and lists all the datasets it provides.
- Type is the connection type, such as arcengine.
- IP is the IP address of the Arcadia instance that originated the request.
Sync indicates that the query results were requested synchronously.
This is normally
truefor commands likeshow databases,show tables, and so on.For most other queries, requests take longer, and the value is
false.-
Cache indicates whether the query was served from the cache.
Possible values are
true, orfalse. -
Cache Check indicates that the query was served from the cache after checking the base data to confirm that no changes occurred between the cache capture and the time the query ran in the cache.
Possible values are
true, orfalse. - Runtime is the time, in seconds, that it takes the query to complete.