Extension Visuals
Extensions add supporting textual or image information to the application. The following steps demonstrate how to create a simple extension visual with text content and minor HTML formatting.
We are working with dataset Census Data [data source default.census_data].
- On the main navigation, click Apps.
-
Above the left navigation bar, click New Visual.
The Select a Dataset modal window appears.
In the modal window, find and then click State Census.
Alternatively, you can use another dataset that uses US Census data.
An Untitled visual screen appears; it is in the default tabular view.
-
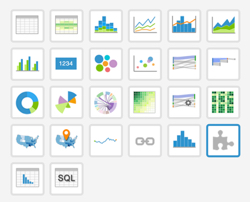
In the Visuals menu, select extension (row 4, column 6).
A new visual screen appears, named
Untitled. -
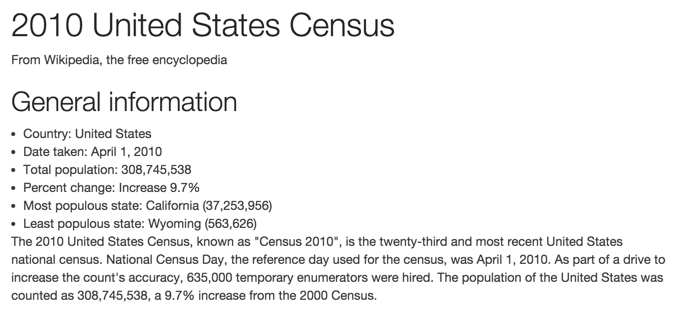
In the text box, paste the following code block.
<h1>2010 United States Census</h1>
<p>From Wikipedia, the free encyclopedia</p>
<h2>General information</h2>
<ul>
<li>Country: United States</li>
<li>Date taken: April 1, 2010</li>
<li>Total population: 308,745,538</li>
<li>Percent change: Increase 9.7%</li>
<li>Most populous state: California (37,253,956)</li>
<li>Least populous state: Wyoming (563,626)</li>
</ul>
<p>The 2010 United States Census, known as "Census 2010", is the twenty-third
and most recent United States national census. National Census Day, the reference
day used for the census, was April 1, 2010. As part of a drive to increase the
count's accuracy, 635,000 temporary enumerators were hired. The population of
the United States was counted as 308,745,538, a 9.7% increase from the 2000 Census.</p>
Click Refresh Visual.
Note the text that appears in the lower portion of the screen.
[Optional] You may wish to ensure that the extension appears without a title when it is used in an application. You can then paste the following code at the beginning of the previous code block:
<style>
  #viz-title-display {
   display:none;
  }
 </style>
Click Refresh Visual.
Click Edit next to the title of the visualization.

- Change the title of the visual. We used 2010 Census Information.
Above the left navigation bar, click Save.