URL Link Visuals
A link visual enhances your applications by accessing external sources of information. These sources may be either static URL addresses, or dynamic — results of searches to which you pass a name of a variable used in the dataset.
The following steps demonstrate how to create a new link visual for dataset World Life Expectancy [data source samples.world_life_expectancy]. In this exercise, we will pass the variable country to the Wikipedia site.
- Start a new visual based on dataset
World Life Expectancy[data sourcesamples.world_life_expectancy]; see Creating Visuals. -
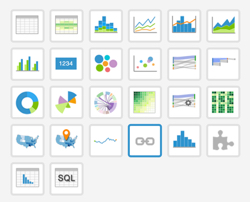
In the visuals menu, find and click link (row 2, column 4).
Note that the shelves of the visual changed. The only visible shelf is URL.
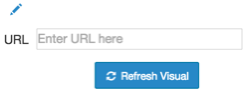
In the URL, enter the following text:
https://en.wikipedia.org/wiki/<<country:Afghanistan>>
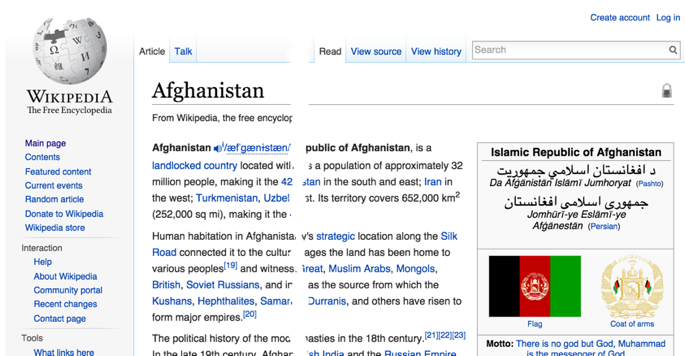
Click Refresh Visual.
The page specified in the URL appears.
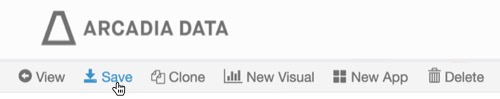
Click Edit next to the title of the visualization.

- Change the title to
World Population - Country UTL. Above the left navigation bar, click Save.
Link Visuals in Action
Extra set-up is required to see the behavior of a dynamic link visual. You must complete the following tasks:
- identify an application that uses it, and add the link to that application
- choose (or add) a chart-type visual in that application to control link display
- configure click behavior on the visual in the previous step
To use this visual to see the Wikipedia page for a specific country, follow these steps.
- Create a new application for this dataset, World Life Expectancy.
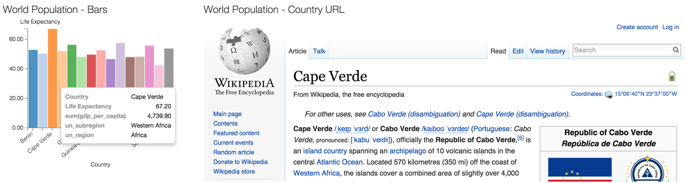
- Add to it the Bar Visual created in Bar Chart, World Population - Bars.
Click Edit next to the title of the application.
By default, it should be set to
Untitled.- Change the title to
World Population - Country UTL. Above the left navigation bar, click Save.
- In the application, click icon to edit the bar chart visual.
In edit mode, left-click on the visual chart, and select Modify click behavior.
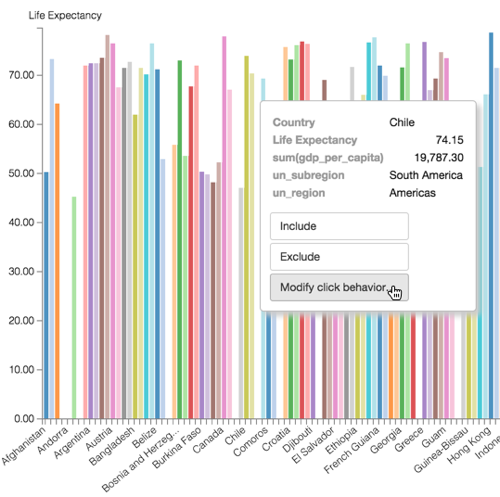
-
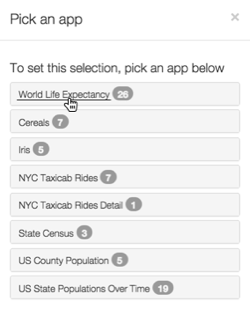
In the Pick an app modal window, below To set this selection, pick an app below, select World Life Expectancy.
After the modal window changes, select World Population - Composite.
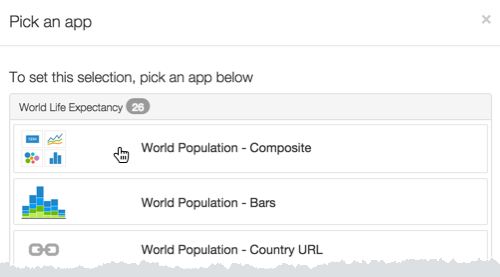
Above the left navigation bar, click Save.
[Optional] While in edit mode, to ensure that the settings work,
- Left-click on the visual.
- Select Test click behavior.
When using the app World Population - Composite, notice that clicking on the specific bars that represent a country changes the Wikipedia page to match the country.