Creating Visuals
The following steps demonstrate how to create a new visual representation.
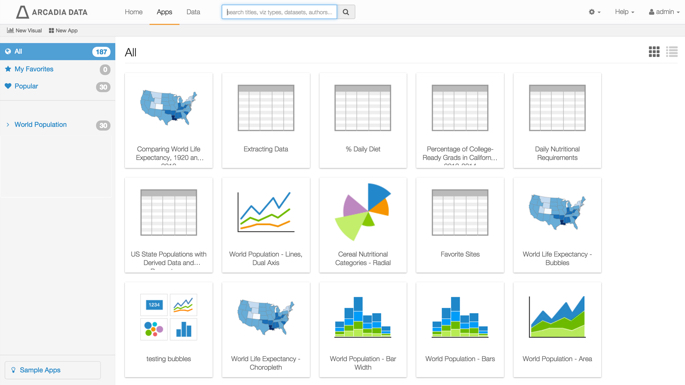
On the main navigation bar, click Apps.
The Apps view appears.
Above the left navigation bar, click New Visual.
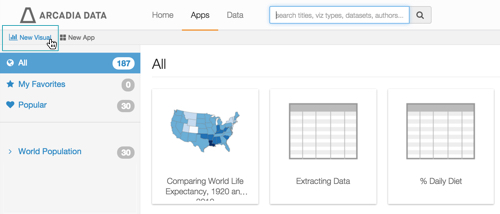
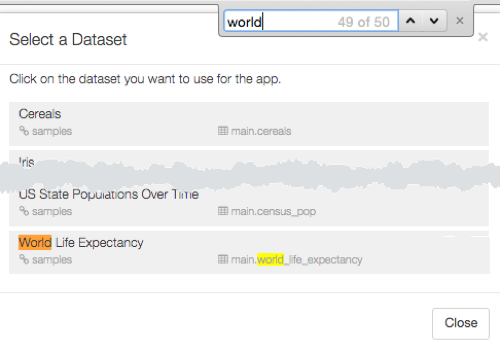
The Select a Dataset modal window appears.
-
In the Select a Dataset modal window, choose World Life Expectancy.
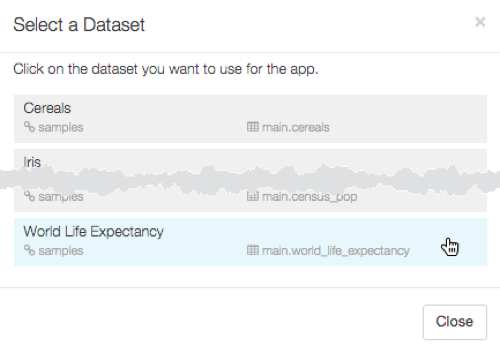
If the list of datasets is too long, use the keyboard keys [Command + F for Mac, or Control + F for PC] to search the modal window.
-
An Untitled visual screen appears, in the default tabular view.
Note that the shelves of the visual (Dimensions, Measures, and Filters) are empty at this time.
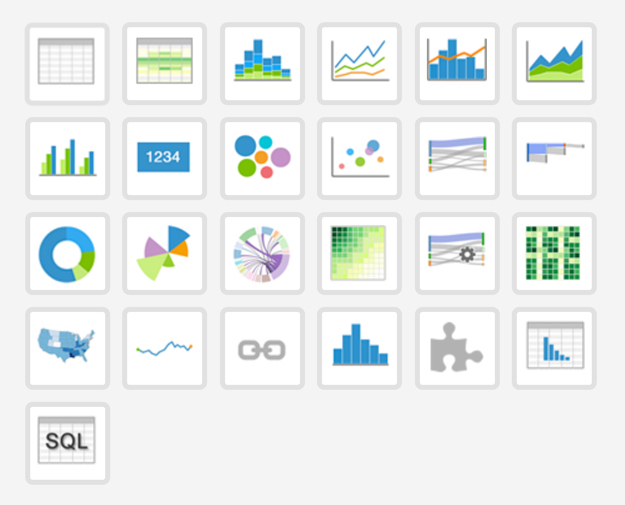
In the visuals menu, select the chart type for the visual.
- Populate the shelves from the available fields (Dimensions, Measures, and so on) listed in the left navigation menu.
- Click Refresh Visual.
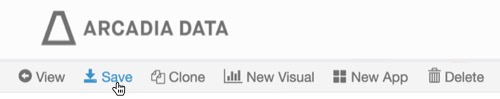
Click Edit next to the title of the visualization.

- Change the title of the visual.
Above the left navigation bar, click Save.