Creating Visuals with Optional Measures
- Open the visual Regional Populations in Edit mode.
- Ensure that you are using the table chart visual type.
- From Measures, select and move
life_expectancyfield onto the Measures shelf. - On the Measures shelf, select
life_expectancyfield, select the Aggregates menu, and then select Remove Aggregate. Click Refresh Visual.
Note that a new column, avg(life_expectancy), appears in the table.
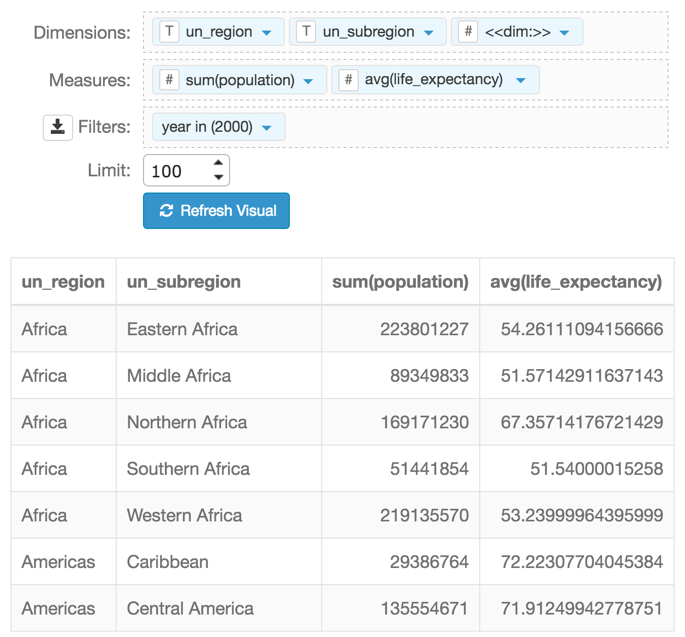
Set-up for Visual - On the Measures shelf, select
life_expectancyfield, and then select Enter/Edit Expression menu. In the Enter/Edit Expression modal window,
- Change the text to the following expression:
[<<mes:>>]. - Click Validate Expression.
- After successful validation, click Save.
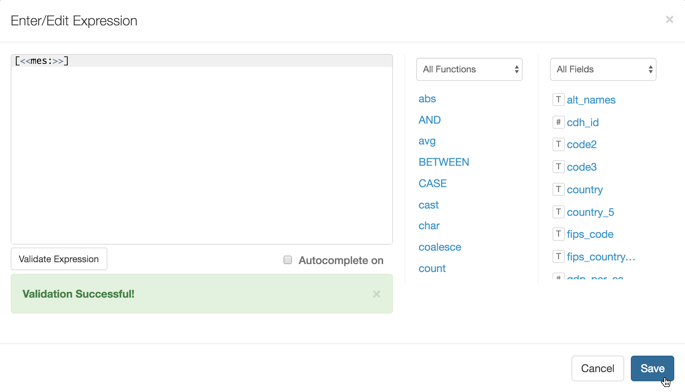
Creating an Optional Measure in Enter/Edit Expression Interface - Change the text to the following expression:
Click Refresh Visual.
Note that the column life_expectancy is no longer in the table.
- Click Save to save the changes to Regional Populations.