Extension Visuals
Extensions add supporting textual or image information to the application. The following steps demonstrate how to create a simple extension visual with text content and minor HTML formatting.
We are working with dataset US State Populations Over Time [data source
samples.census_pop].
- Start a new visual based on dataset
US State Populations Over Time[data sourcesamples.census_pop]; see Creating Visuals. -
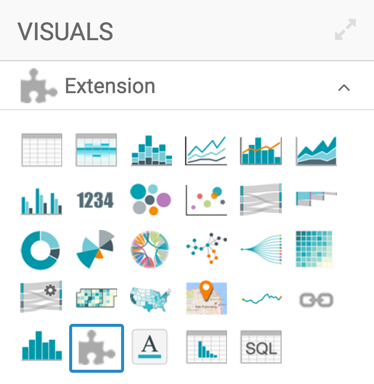
In the Visuals menu, select extension (row 5, column 2).
-
Note that the shelves of the visual changed. Instead of more common shelves, this visual type has a single text box for entering and editing text, markup, and so on.

-
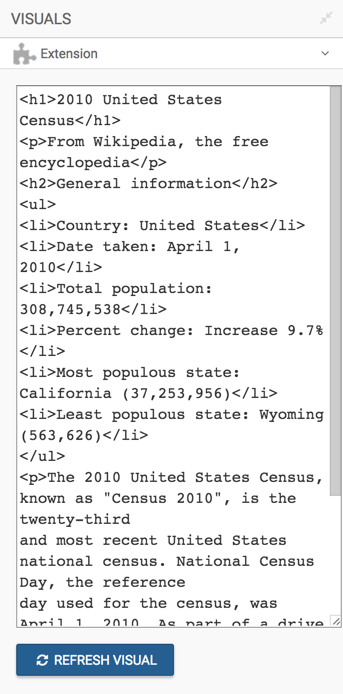
In the text box, paste the following code block.
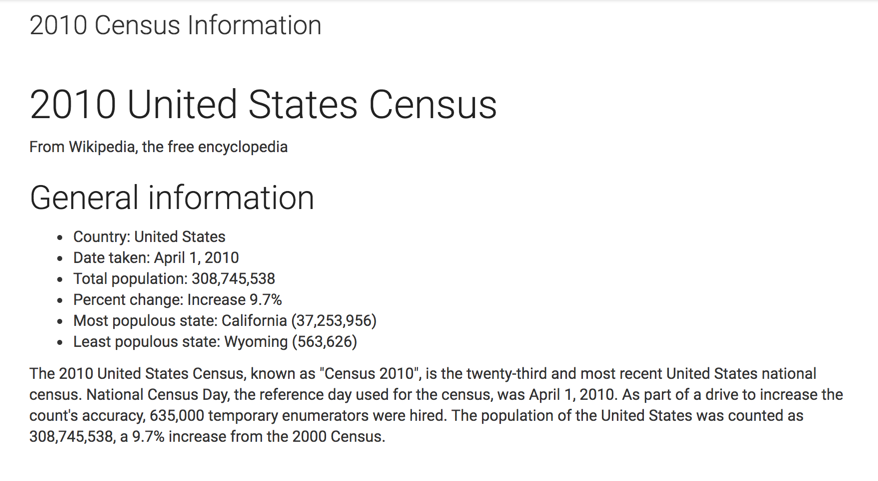
<h1>2010 United States Census</h1>
<p>From Wikipedia, the free encyclopedia</p>
<h2>General information</h2>
<ul>
<li>Country: United States</li>
<li>Date taken: April 1, 2010</li>
<li>Total population: 308,745,538</li>
<li>Percent change: Increase 9.7%</li>
<li>Most populous state: California (37,253,956)</li>
<li>Least populous state: Wyoming (563,626)</li>
</ul>
<p>The 2010 United States Census, known as "Census 2010", is the twenty-third
and most recent United States national census. National Census Day, the reference
day used for the census, was April 1, 2010. As part of a drive to increase the
count's accuracy, 635,000 temporary enumerators were hired. The population of
the United States was counted as 308,745,538, a 9.7% increase from the 2000 Census.</p>
-
Click Refresh Visual.
-
Note the formatted text appears in the visualization area of Visual Builder.
-
Change the title to
2010 Census Information.-
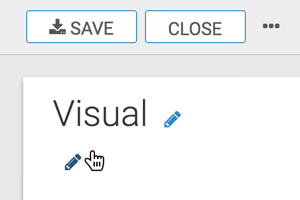
Click (pencil icon) next to the title of the visualization to edit it, and enter the new name.

[Optional] Click (pencil icon) below the title of the visualization to add a brief description of the visual.
-
At the top left corner of the Visual Designer, click Save.

At the top left corner of the Visual Designer, click Close.

Your visual should look something like this: