Selecting a Range of Number Values on Filter Shelves
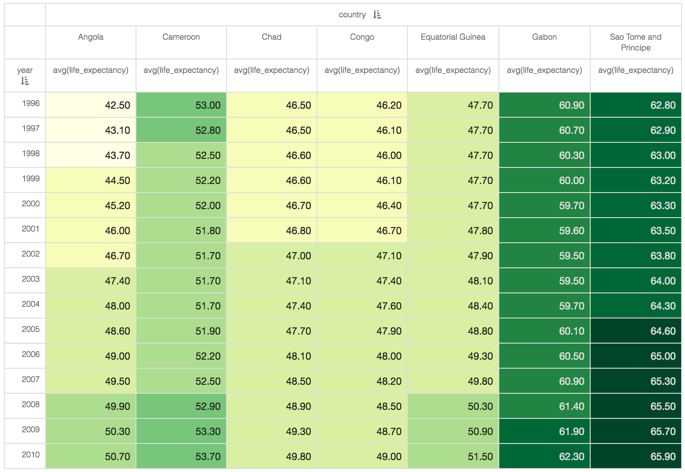
For selecting a range of numerical values in a filter shelf, let's use the example from building Cross Tabulation Visuals, where we specify several discrete years of the dataset World Life Expectancy.
-
On the Filters shelf, click (down arrow) on the
yearfield placed there earlier, then click Select values.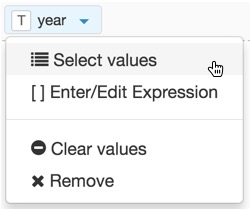
-
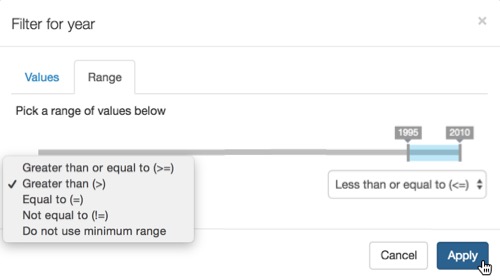
In the Filter for year modal window, click the Range tab, and then slide the range upper and lower values to select the range of values used by the visual.
By default, the lowest value of the range is at the extreme left of the slide control (set to >=), and the highest value is on the extreme right (set to <=). You can change the end-point specifications of the range.
The valid operators for the bottom of the range are:
- Greater than or equal to (>=)
- Greater than (>)
- Equal to (=)
- Not equal to (!=)
- Do not use minimum range
The valid operators for the top of the range are:
- Less than or equal to (<=)
- Less than (<)
- Do not use maximum range
-
After clicking Refresh Visual, the cross-tabulation visual appears. Note the range of years we specified in the previous step.