Percentage of Previous Analytic Function
We are using US Census data to create a visual that uses the Percentage of Previous analytic function.
To use the Percentage of Previous analytic function with US Census data, follow the general steps in the Example.
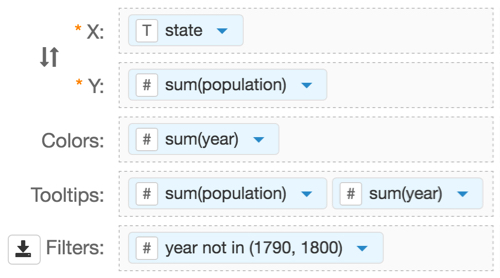
US Census dataset, download the census-pop.csv.zip file, uncompress it, Importing Data into Arcadia, and Creating Datasets.The input set up for the Percentage of Previous visual follows:
- X shelf:
state - Y shelf:
sum(population), for now - Colors shelf:
year - [Optional] Tooltips shelf:
sum(population),sum(year) Filters shelf: exclude the following years of the census:
1790and1800.There is insufficient data for these years, and it skews the results.
- X shelf:
On the Y shelf, click the icon to the right of the variable.
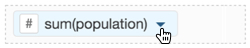
Accessing Field Options -
In the dropdown, hover over Analytic Functions.
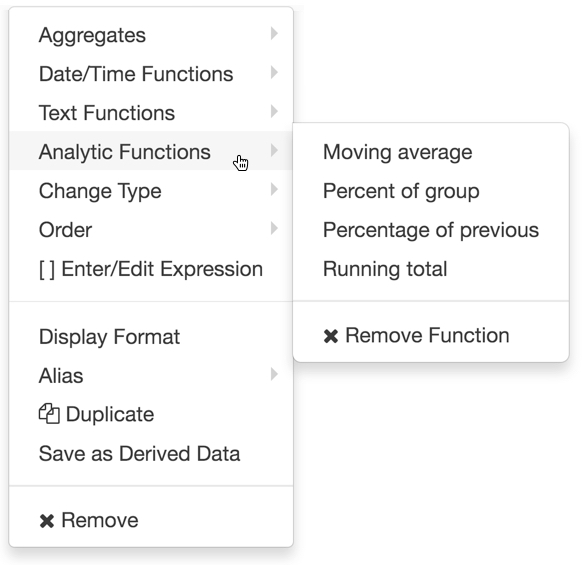
Analytic Functions Options - From the Analytic Functions menu, select Percentage of previous.
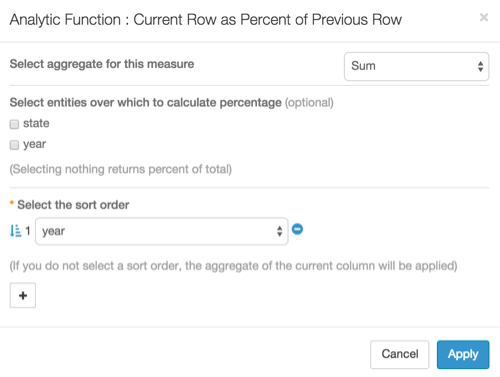
In the Analytic Function: Current Row as Percent of Previous Row modal window,
- In Select aggregate for this measure, leave the default Sum
- Under Select entities over which to calculate percentage, select state;
Under Select the sort order, click the (add/plus) icon, select year, and then set it to ascending sort order.
Note that you can add additional sort parameters, by clicking the (add/plus) icon.
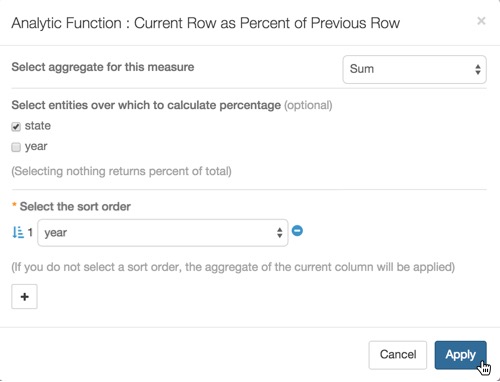
Analytic Function: Current Row as Percent of Previous Row Interface - Click Apply.
Click Refresh Visual.
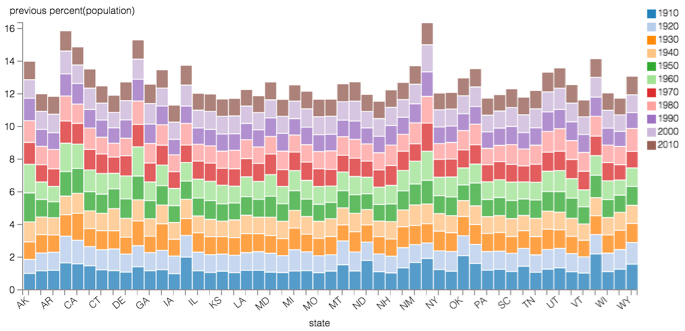
Percentage of Previous for State Populations over Time; Stacked Bar Chart Note the expression used for calculating the percentage of previous:
sum([population]) / lag(sum([population]), 1) over (partition by [state] order by [year])
  as 'previous percent(population)'
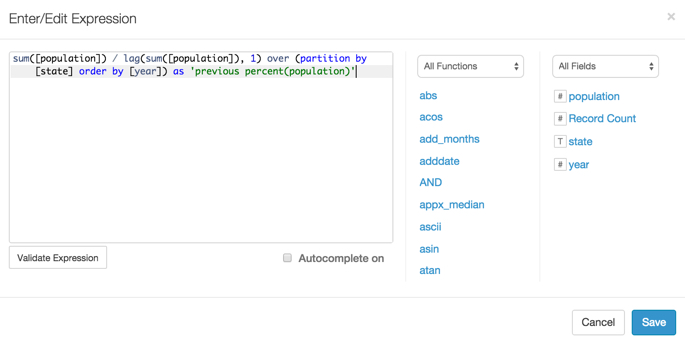
Viewing the Percent of Previous Expression
Percentage of Previous Analytic Function
Follow these general steps to create a running total visual:
When creating or editing a visual, determine for which field variable you must apply an analytic function.
The shelves that support analytic functions depend on the visual type, and are typically available for X and Y axes, Measures, Dimensions, Colors, and Tooltips.
Click the icon to the right of the variable.
Accessing Field Options In the dropdown, click Analytic Functions.
From the Analytic Functions menu, select Percentage of previous.
The Analytical Function: Current Row as Percent of Previous Row modal window appears.
Analytic Function: Current Row as Percent of Previous Row Interface In the Analytical Function: Current Row as Percent of Previous Row modal window, in Select aggregate for this measure, choose one of:
- Sum [default]
- Count
- Approx Distinct Count
- Exact Distinct Count
- Minimum
- Maximum
- Average
- [Optional] Under Select entities over which to calculate percentage, select one or more entities listed in the modal window.
[Optional] Under Select the sort order, specify the sort order. If you don't specify it, the current column's aggregate is the sort order.
- Click the (add/plus) icon to add the sort field; choose between None and a few pre-selected options (what is already on the shelves of the visual).
- Specify either (ascending) [default] or (descending) sort order.
- To add more sorting categories, click the (add/plus) icon and specify the new sort mechanism.
- Click Apply.
- Click Refresh Visual.