Drill Into Data Discovery
Drill Into enables you to discover the more granular information for a particular data point by examining other dimensions of your data. It uses the exact portion of the graph you click to determine the filters, and the selected field as the new horizontal axis. You may further limit the fields available in Drill Into.
Drill Into is available on Bar, Line, Area, Grouped Bars, and Map (choropleth only) visuals, and also on trellised charts of these visual types.
To use the Drill Into feature, follow these steps:
- Open a dashboard that contains the visual you are examining. We are demonstrating this in Edit view.
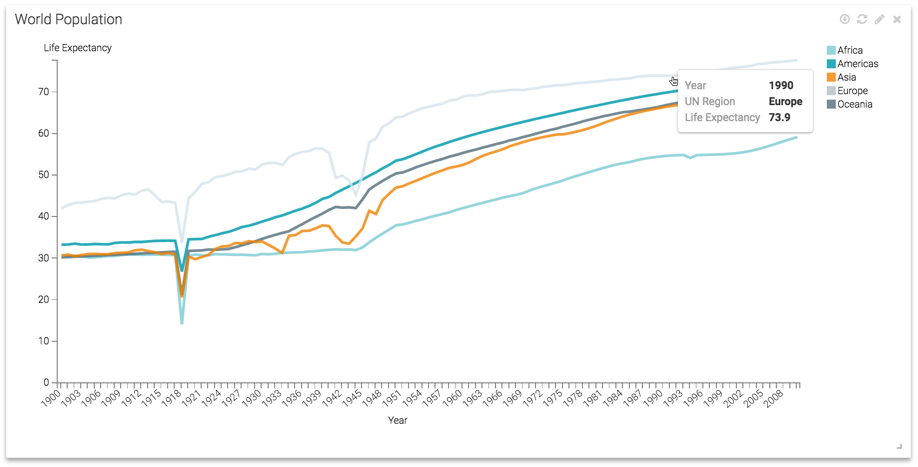
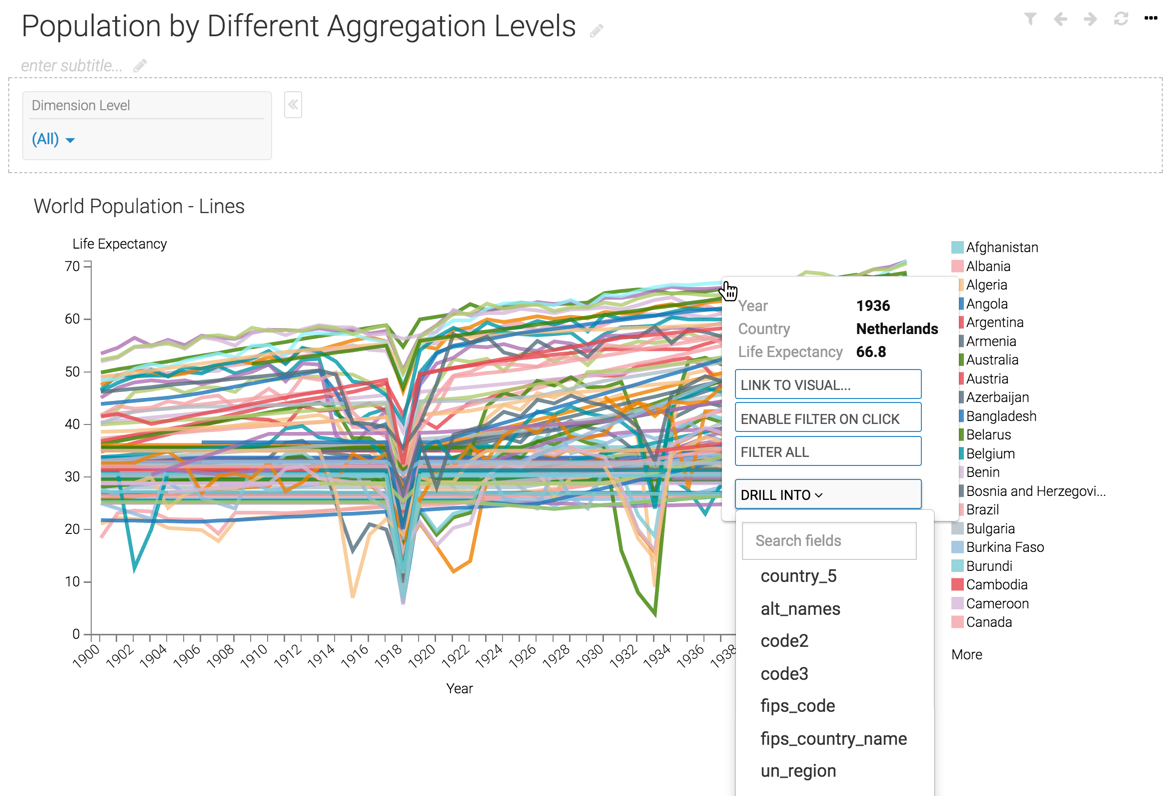
Hover over the visual to determine what portion of the graph to examine further.
Here, we are selecting the line for Europe, in year 1990. Note that these values become filters in the visual generated by the Drill Into choice.
Click on the selected part of the graph, and Arcadia Enterprise expands to show the available data discovery options.
Select the Drill Into option, and then select the appropriate field from the drop-down menu. Note that you have an option to limit the available fields; see Limiting Drill Into Options.
Here, we selected the
countryfield.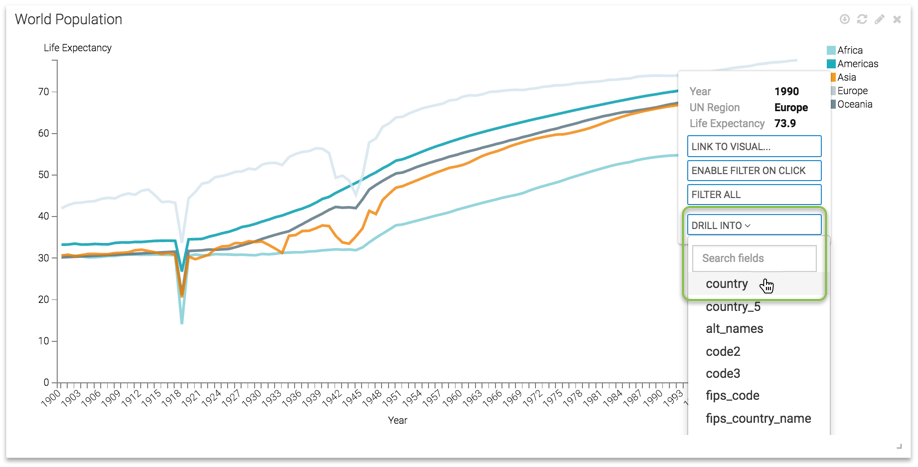
-
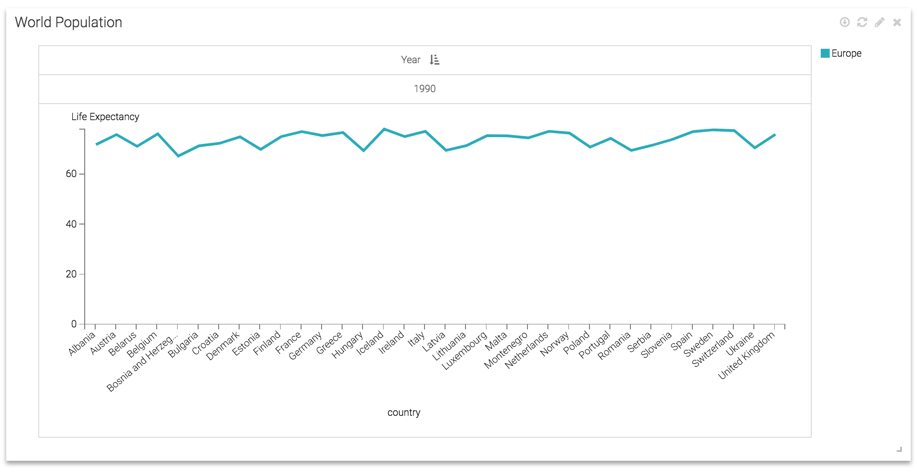
Arcadia Enterprise replaces the visual with a version that implements the filters specified earlier: Europe in year 1990. Notice also that the field chosen in the previous step specifies the horizontal axis, where appropriate. In Choropleth Map visuals, it changes the granularity of regions represented, moving from County, to State, to County, and so on.
Limiting Drill Into Options
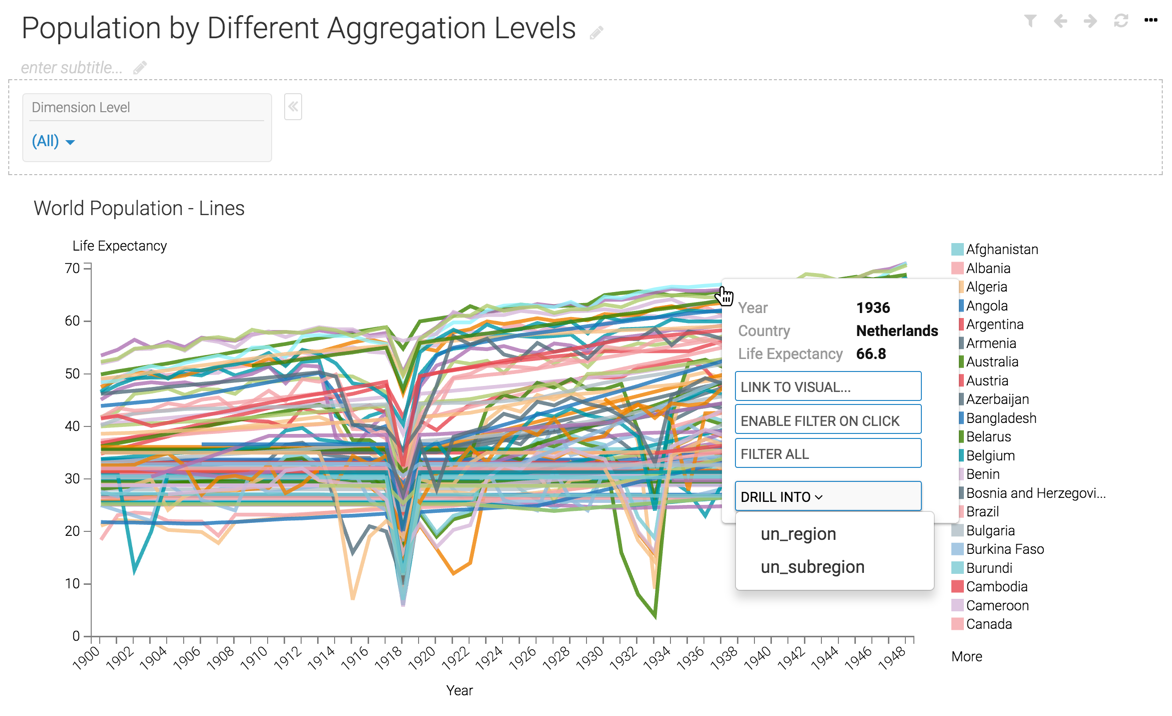
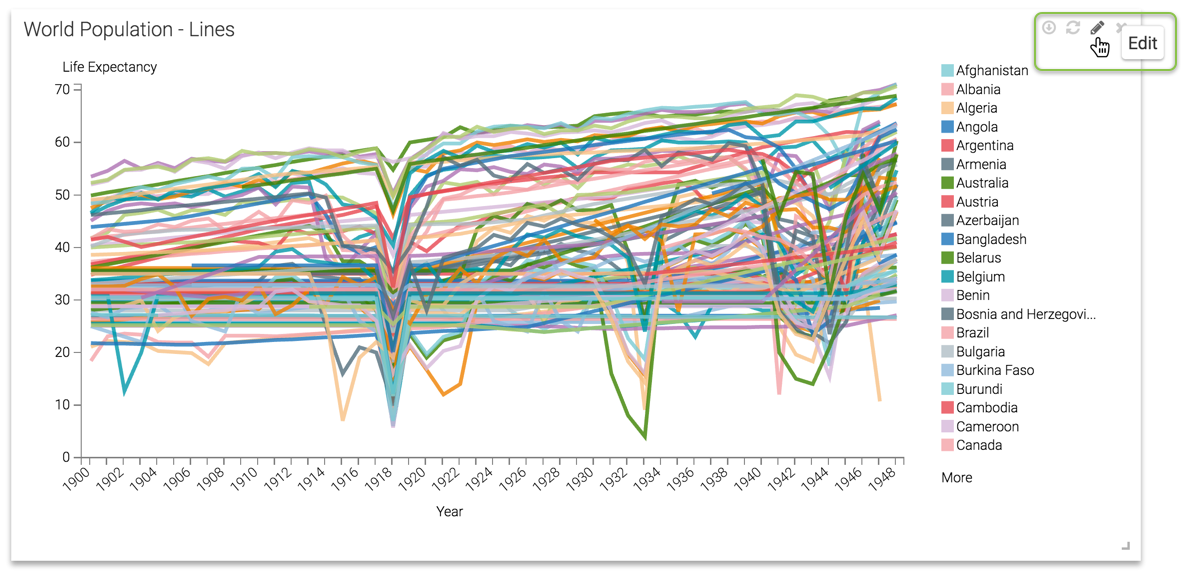
By default, all dimensions are visible when implementing Drill Into. The following image illustrates this in the dashboard in Edit mode.
To limit the fields available for Drill Into to a smaller subset, you must place these fields onto the Drill shelf. When specifying a limit for Choropleth Map fields, these fields must be Geo Type fields, or cast to Geo Type.
-
With the dashboard in Edit mode, click the (pencil/edit) icon of the visual to edit it.
-
In the visual, add the desired fields to the Drill shelf.
Here, we added the fields
un_regionandun_subregion.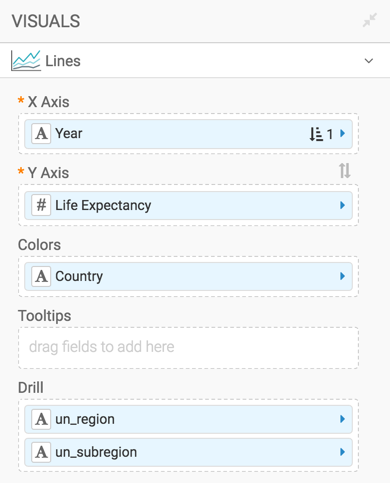
- Save and Close the visual.
- If you use the Drill Into option, the menu shows only the fields we specified in the
previous step,
un_regionandun_subregion.