Hiding Fields from Applications
You may find it useful to hide dataset fields that are not typically used for visualizations, or hide them in order to prevent unintended bias in visualizations.
The following steps demonstrate how to prevent data fields from appearing in visualizations and applications of dataset World Life Expectancy [data source samples.world_life_expectancy]. The fields comments, lat, and lng are empty, so they are good candidates for this operation.
On the main navigation bar, click Data.

The Data view appears, open on the Datasets tab.
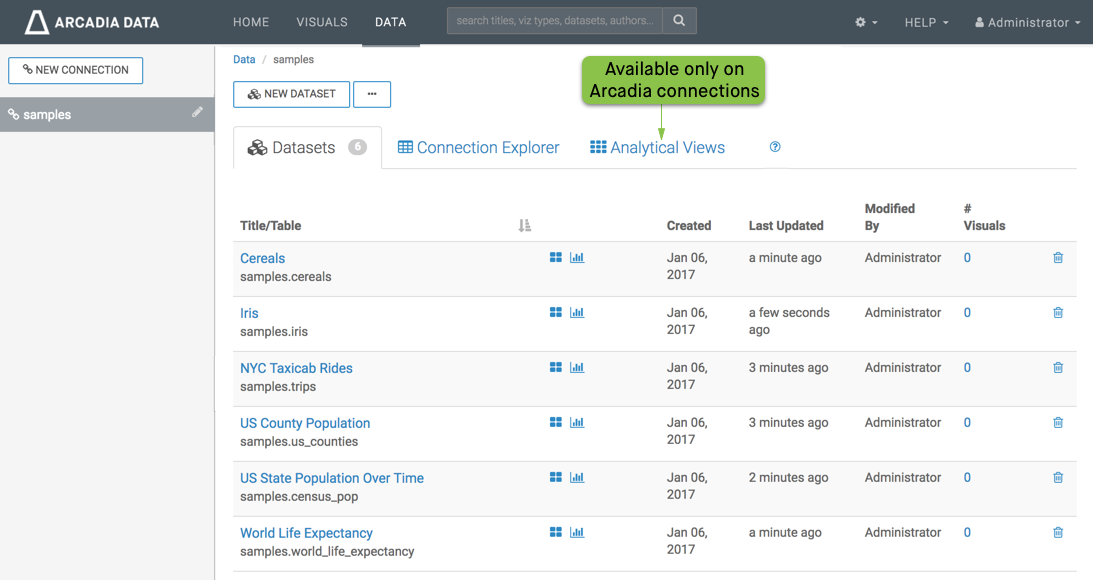
- In the left navigation menu, click samples.
-
In the Datasets area, select World Life Expectancy
(samples.world_life_expectancy).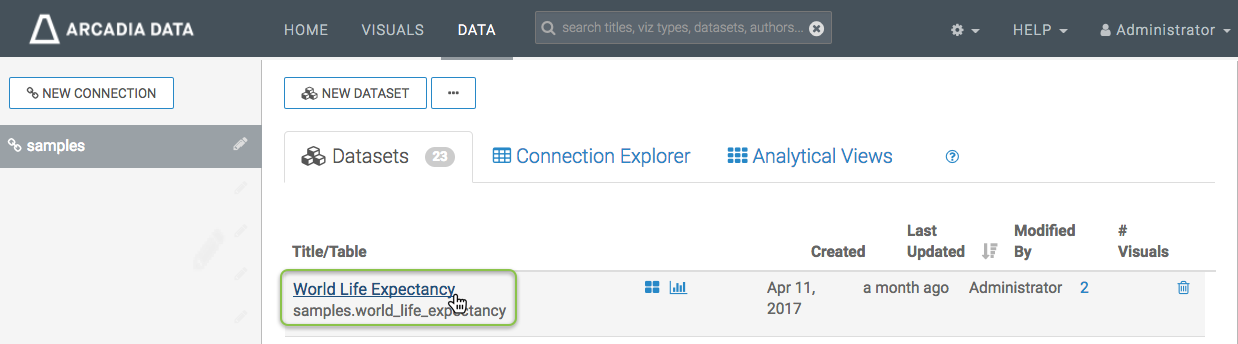
Selecting Dataset 'World Life Expectancy' -
In the Dataset Detail menu, select Fields.
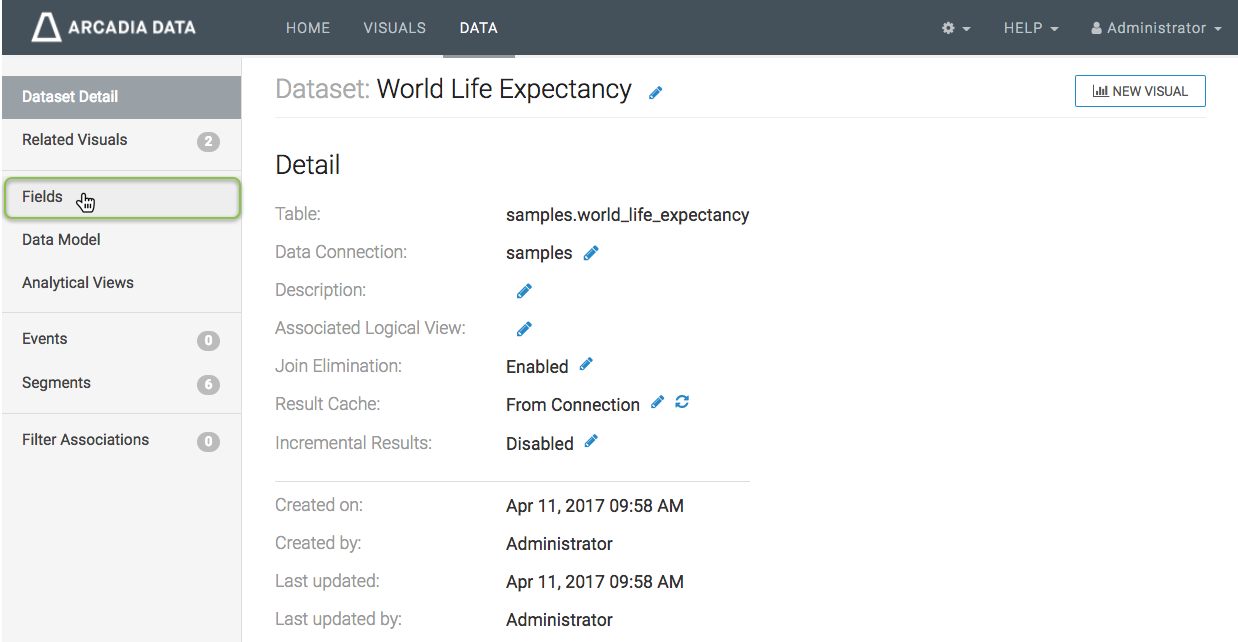
Dataset Detail for 'World Life Expectancy' -
In the Fields interface, select Edit Fields.
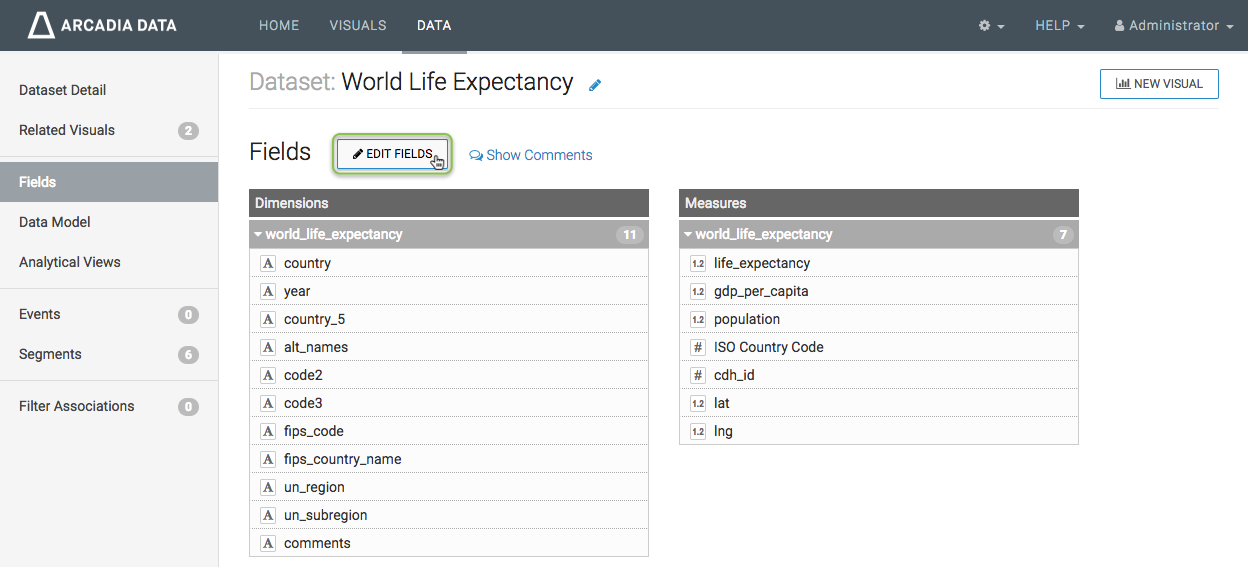
Editing the Fields of Dataset 'World Life Expectancy' - Under Dimensions, find the field
comments. Click (eye) icon on the
commentsline.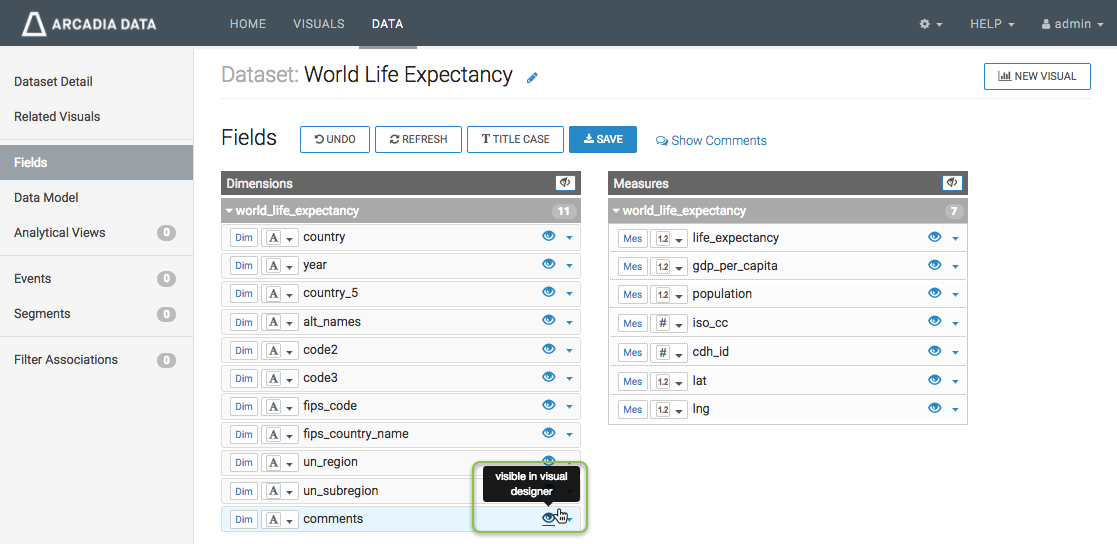
Turning Off the Visibility of a Field in a Dataset Note that the icon next to the
commentfield changed to (slashed eye).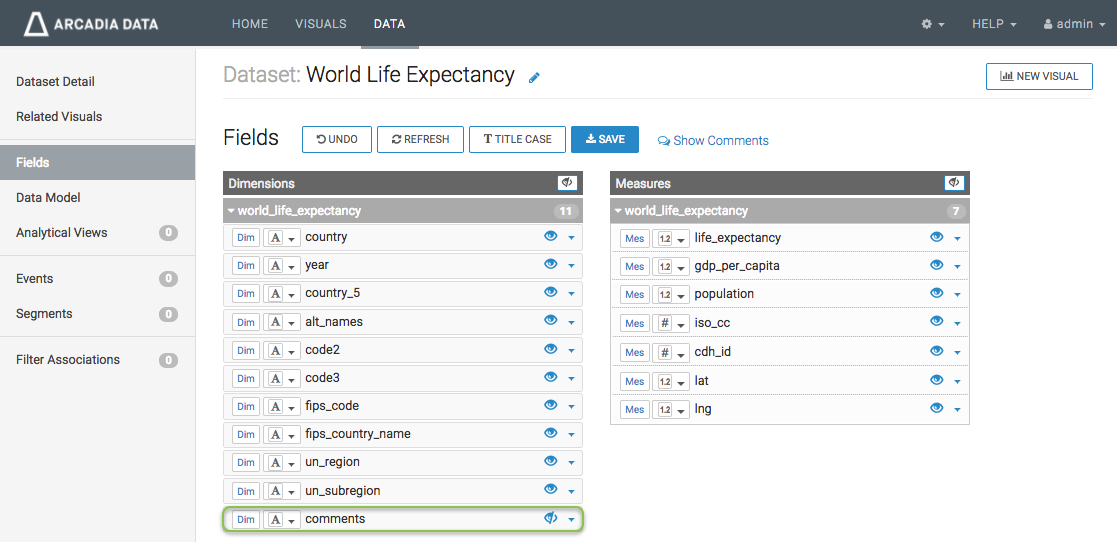
Confirming that a Field is Hidden Under Measures, find the fields
latandlng, and hide them.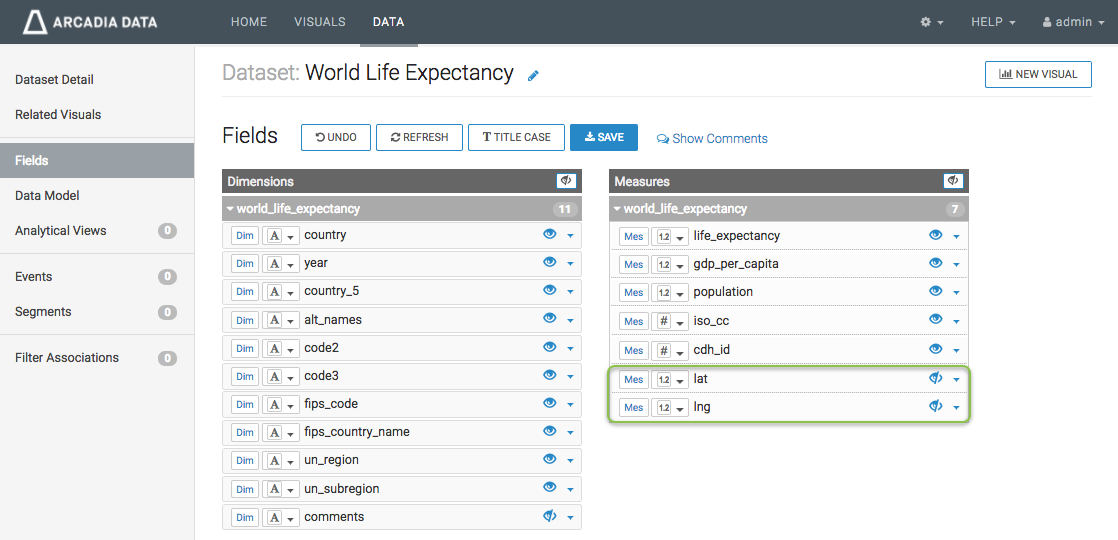
Hiding Other Fields Click Save.
Note that in the updated Fields interface, Dimensions table has a total of
11fields and Measures table lists a total of7fields, as before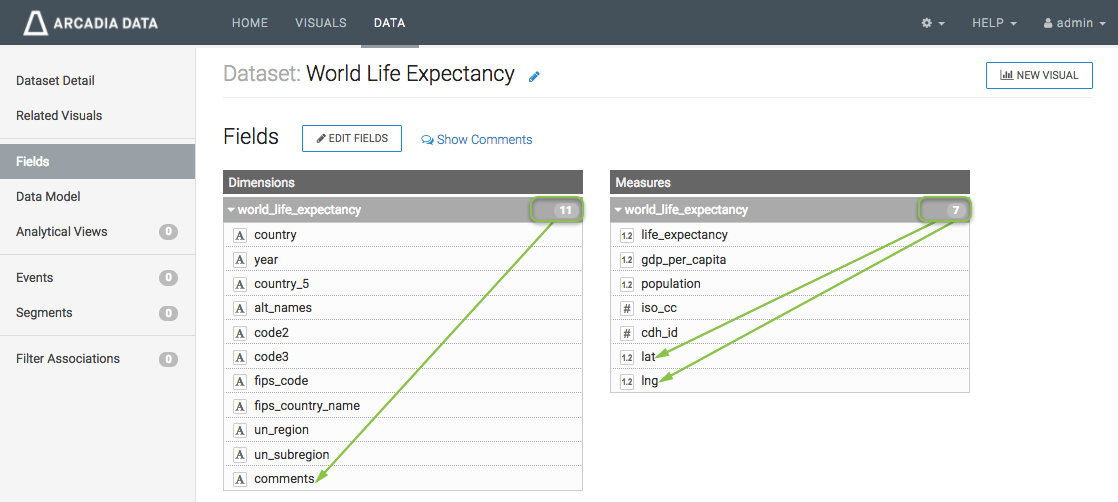
Dataset Fields Interface Includes Hidden Fields However, when using Visual Designer, the hidden fields do not show.
- The number of Dimensions is 11. This is calculated as All Dimensions (11) - Hidden Dimensions (1) + Segment (1).
- The number of Measures is 6. This is calculated as All Measures (7) - Hidden Measures (2) + Record Count (1).
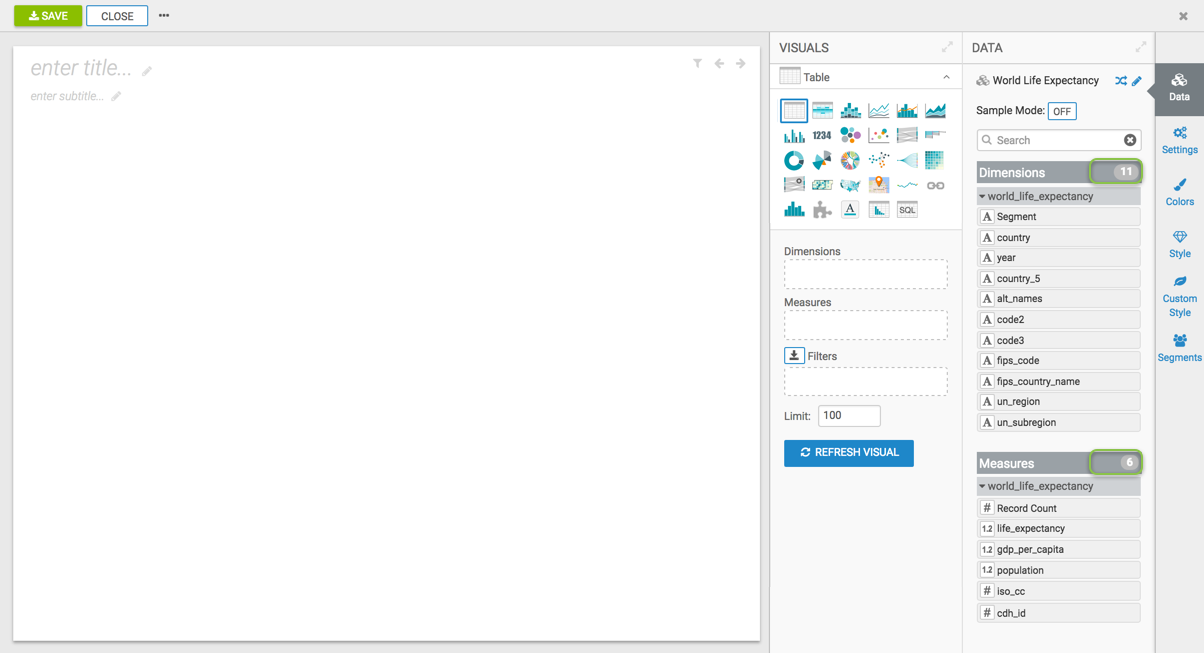
Visual Builder Without Hidden Fields
Note that the field visibility can be changed in the Edit Field Paramters window modal.