Changing Legend Style and Removing the Legend
To change the legend style (where on the visual legend appears), navigate to the Marks menu, and select Legend Style.
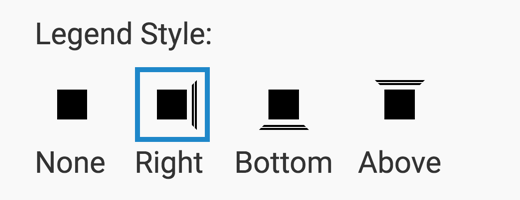
Note that the legend appears on the right side of the visuals, by default. This setting can be changed to show the legend on the bottom, or above the visual.
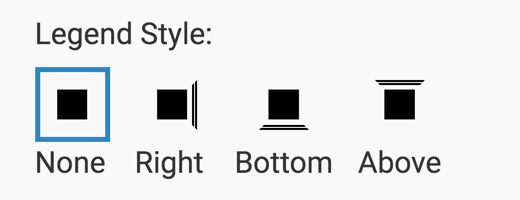
To remove the legend, which is on by default, navigate to the Marks menu, select Legend Style, and choose the option None.
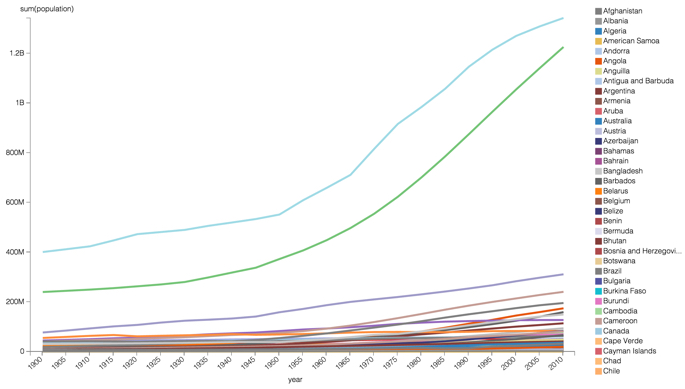
Here is an example of a line chart with a legend showing. The legend represents dimensions as distinct colors.
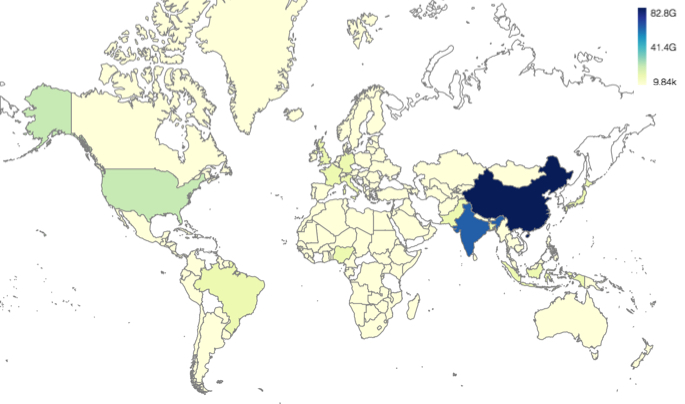
For graphs that map a continuum of values, such as choropleth maps, the legend shows a sliding scale of color and values at the minimum, median, and maximum.