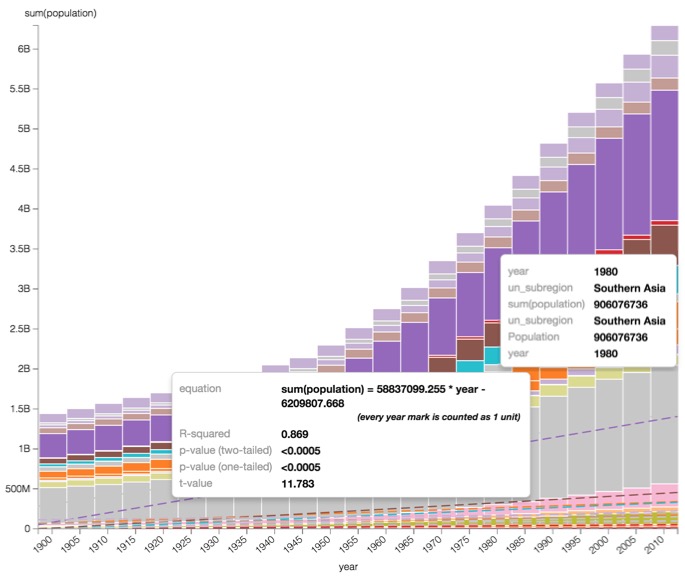
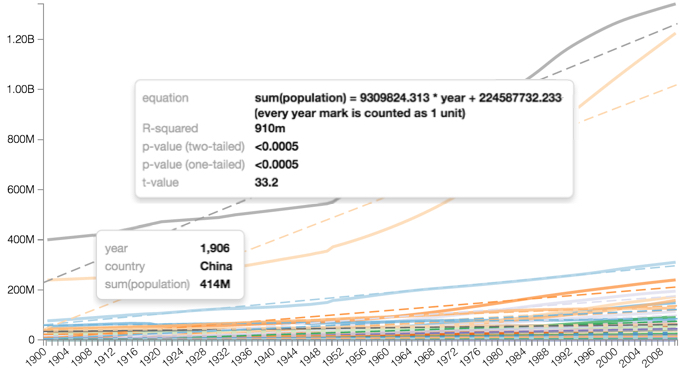
Displaying a Linear Trendline
To display a linear trendline for the graph, navigate to the Marks menu, and select Display linear trendline.

Note that the trendlines appear on the visual. To see the specific values related to the calculation of the trendline, hover your mouse over the trendline and examine the information in the Tooltip window.
Here is a line visual with trendlines.
Here is a bar visual with trendlines.