Using the Date Picker
The date picker enables you to select a subset range of dates for visualization. This article describes how to use a date picker in a calendar heat map visual.
The following steps use a calendar heat map visual, such as the one described in Calendar Heat Map Visuals, which is built on the dataset SFPD Incidents [data previously imported into Arcadia from the datafile sfpd-incidents.csv.zip, data source default.sfpd_incidents]. If you have not already done so, import the datafile into Arcadia Enterprise, and then define the SFPD Incidents dataset.
- Open
SFPD Incidents - Calendar Heat Map, created according to the instructions in Calendar Heat Map Visuals. -
Under Dimensions, select
datetimeand drag it to the Filters shelf of the visual, and drop it to add it to the shelf.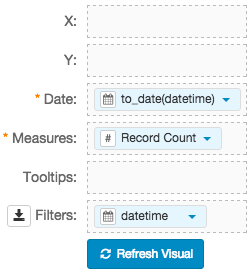
At the top left corner of the Visual Designer, click Save.

- Start a new app: click New App.
- In the App design view, in the left menu area, click the Visuals tab.
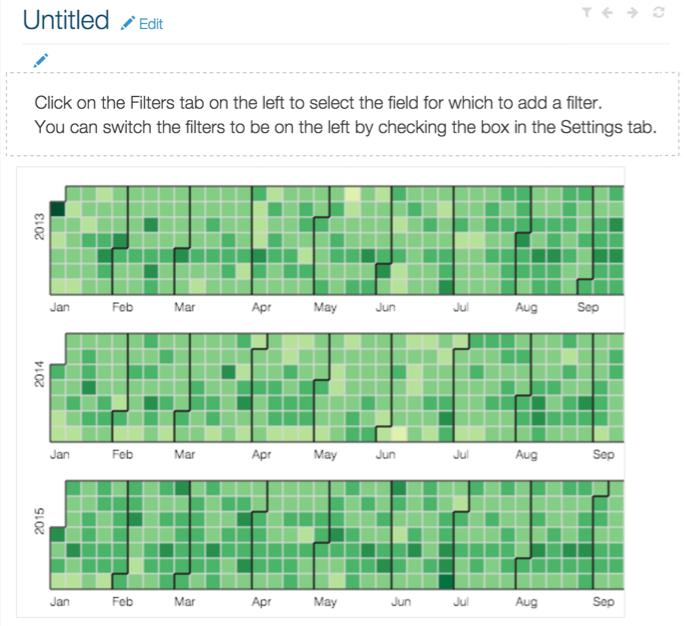
Ensure that you are using the SFPD Incidents dataset, and click SFPD Incidents - Calendar Heat Map visual.
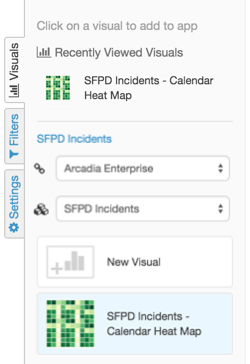
Note that the visual appears in the main app area.
- In the App design view, in the left menu area, click the Filters tab.
Under the Dimensions category, click
datetimefield.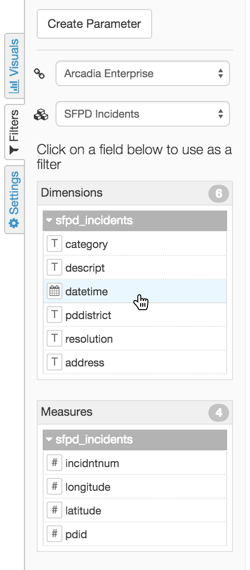
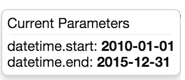
Note that this adds an application control, based on the field
datetime, typetimestamp, to the application.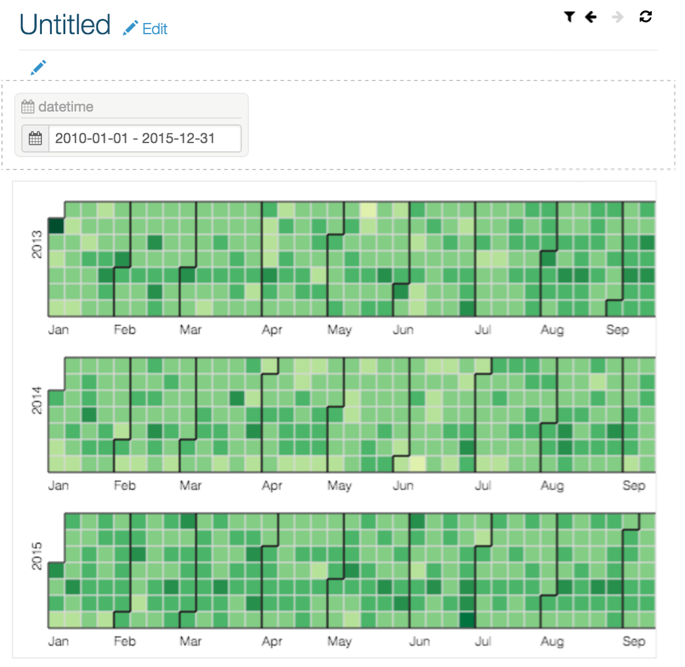
The filter contains the date range 2010-01-01 through 2015-12-31.
Click the datetime application control to see the date picker interface.
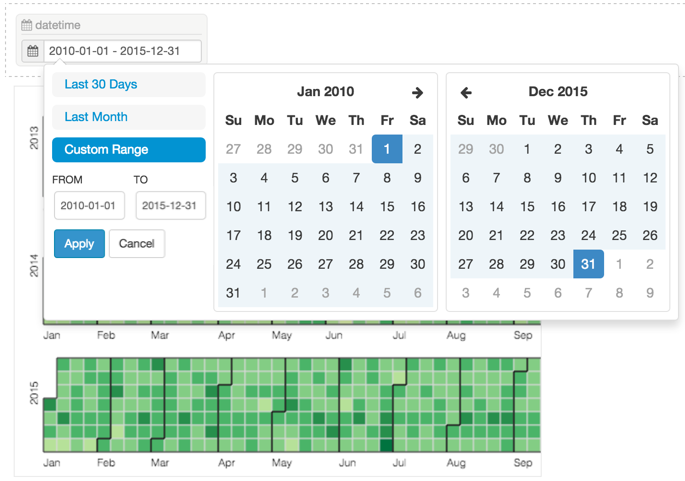
Note that you can change the date range in various ways:
- by selecting the Last 30 Days or Last Month options
- by changing the date entries for FROM and TO fields
- by picking the start and end dates on the calendar interface
-
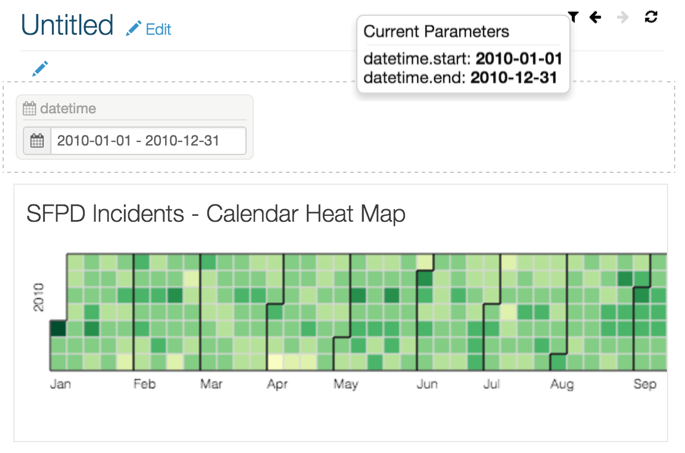
Change the date range to 2010-01-01 through 2010-12-31, and click Apply.
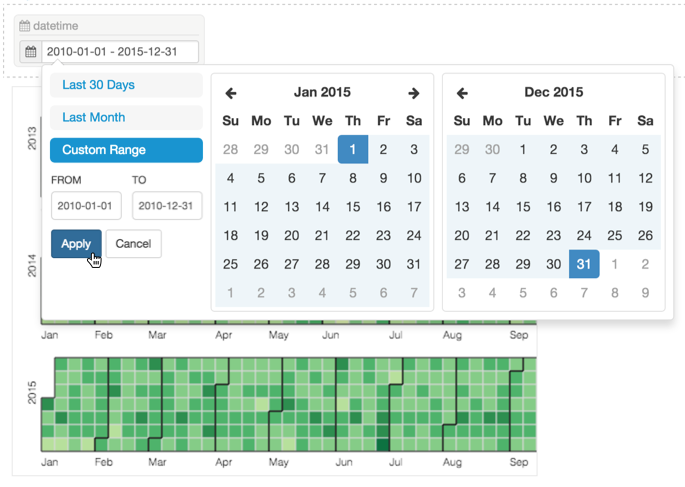
Note that the visual output is now limited to the 2010 calendar year, and that the application filter shows the new date range.
- Name and save the application. We used the name SFPD Incidents Date Picker.