Single Value Visuals
Single value charts emphasize particular ares of dashboards or applications. They can be used to provide section titles, totals for segmented data, draw attention to aggregation results, and for many other things.
The following steps demonstrate how to create a new single value visual representation on dataset Customer Value Analysis. This dataset is based on data previously imported into Arcadia from the datafile customer-value-analysis.csv.
- Start a new visual based on dataset Customer Value Analysis; see Creating Visuals.
-
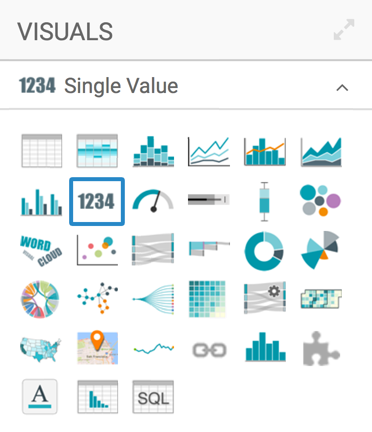
In the visuals menu, find and click Single Value (row 2, column 2).
-
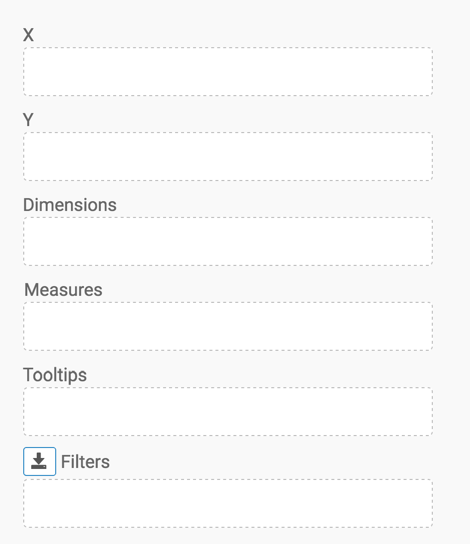
Note that the shelves of the visual changed. They are now X, Y, Dimensions, Measures, Tooltips, and Filters.
There are no mandatory shelves for single value visuals.
-
Populate the shelves from the available fields (Dimensions, Measures, and so on) in the Data menu.
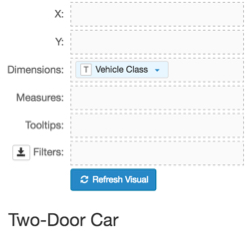
- Under Dimensions, select
Vehicle Classand drag it over the Dimension shelf on the main part of the screen. Drop to add it to the shelf.
- Under Dimensions, select
-
Click Refresh Visual.
The single value visual appears.
-
Click (pencil icon) next to the title of the visualization to edit it, and enter the new name.
- Change the title to
Vehicle Class. At the top left corner of the Visual Designer, click Save.
