Word Cloud Visuals
Word Clouds aggregate text data, and display the words with higher frequency of occurrence. We use them to emphasize prominent phrases or words in textual data.
World clouds include many manual setting adjustments.
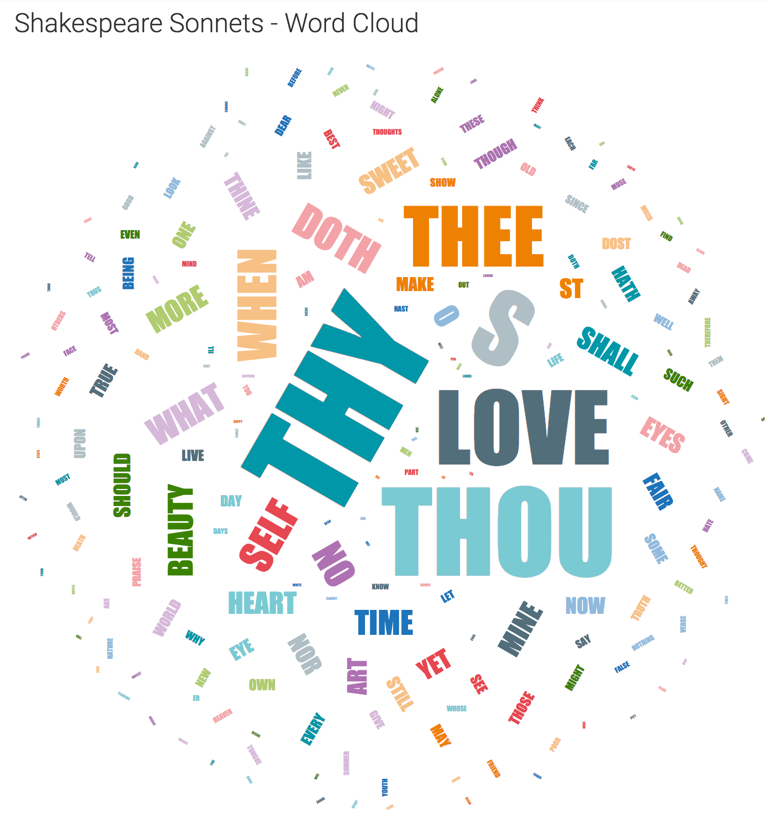
We are working with the dataset Shakespeare's Sonnets, created from the datafile shakespeare_sonnets.csv.
- Start a new visual based on dataset Shakespeare's Sonnets. See Importing Data, Creating Datasets, and Creating Visuals.
-
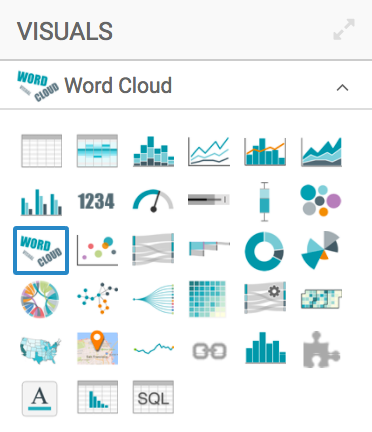
In the visuals menu, find and click Word Cloud (row 3, column 1).
-
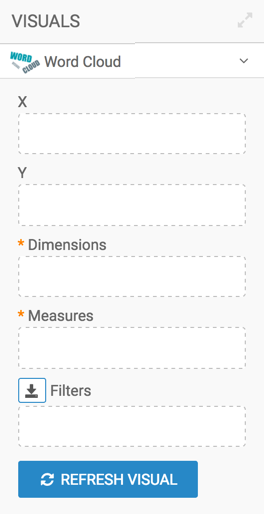
Note that the shelves of the visual changed. They are now X, Y, Dimensions, Measures, and Filters. The mandatory shelves are Dimensions and Measures.
-
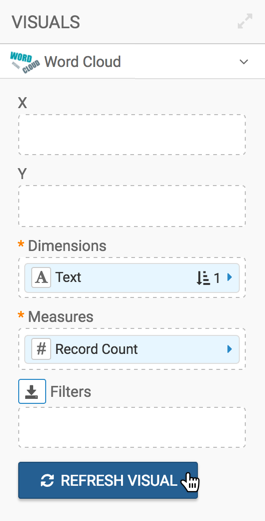
Populate the shelves from the available fields:
- Add the field
Textto the Dimensions shelf. - Add the field
Record Countto the Measures shelf.
- Add the field
-
Click Refresh Visual.
-
Change the title to
Shakespeare Sonnets - Word Cloud.-
Click (pencil icon) next to the title of the visualization to edit it, and enter the new name.
[Optional] Click (pencil icon) below the title of the visualization to add a brief description of the visual.
-
At the top left corner of the Visual Designer, click Save.

At the top left corner of the Visual Designer, click Close.
The visual should look something like this:
To adjust the Word Cloud display, check all the available settings for this visual.
Often, it is interesting to compare different texts by examining their different word clouds. See Trellised Word Clouds