Creating Visuals
The following steps demonstrate how to create a new visual representation in Arcadia Enterprise.
-
[Option 1] On the main navigation bar, click Data.
Select the appropriate connection.
Under the Datasets tab, find the appropriate dataset, and click (bar chart) icon to create a New Visual.
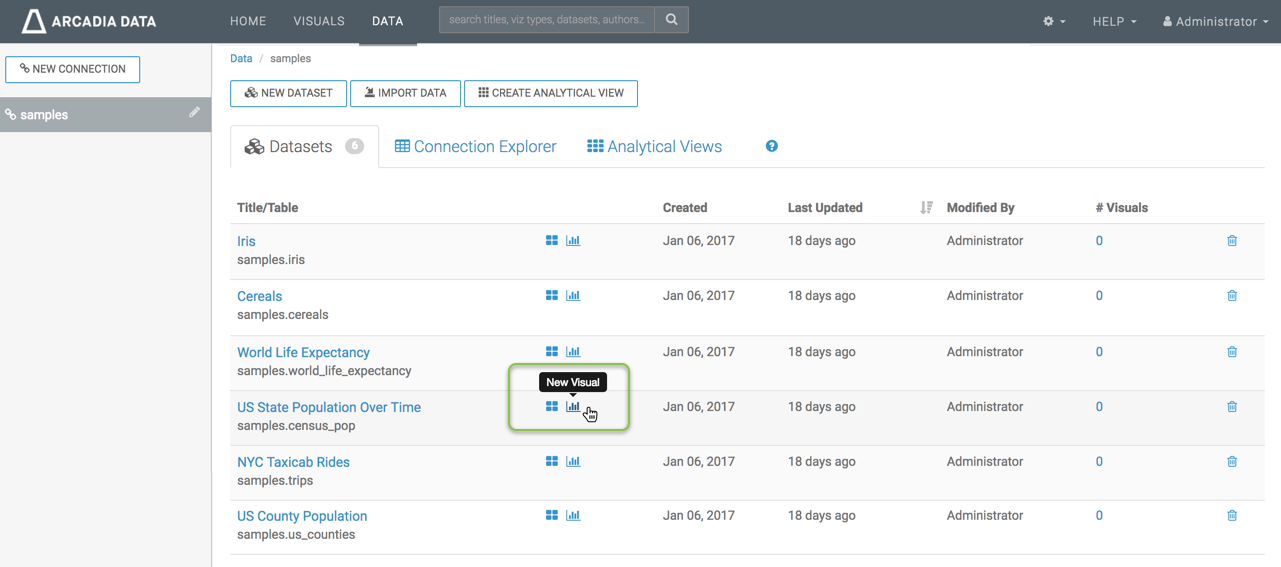
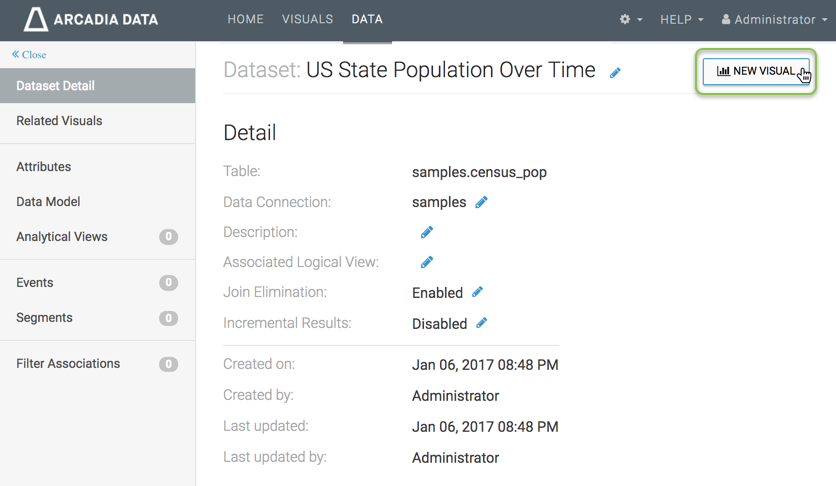
[Option 2] You can navigate to the Dataset Detail of the relevant dataset using the same steps as above, and then clicking on the title of the dataset.
If you know the dataset_id, navigate directly to the Dataset Detail interface using the URL address of the form
MyArcadia:MyPortal/arc/apps/dataset/dataset_id. For example, we usedhttp://127.0.0.1:8000/arc/apps/dataset/3.Click New Visual at the top right corner.
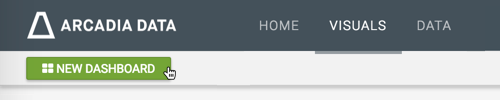
[Option 3] On the main navigation bar, click Visuals.
Click New Dashboard to open a new dashboard, in Edit mode.
Alternatively, click an existing dashboard, and then click Edit to make changes to it.
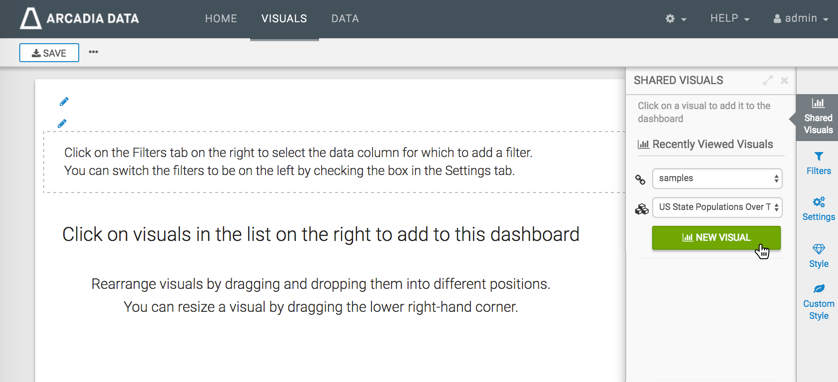
In the Dashboard Builder interface, open the Shared Visuals menu, and then click New Visual .
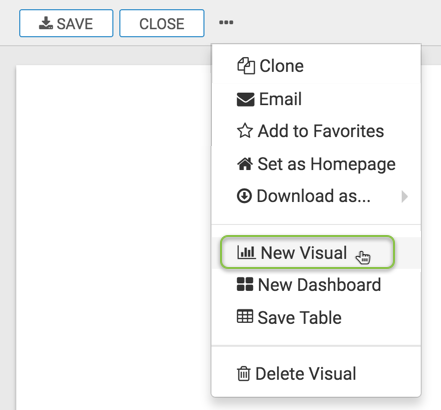
[Option 4] When you are already using Visual Designer to develop a visual, start another new visual by clicking the (ellipsis) icon at the top of the interface, and select New Visual.
-
The Visual Designer interface appears. See the overview of Visual Designer for Visuals to familiarize yourself with its components.
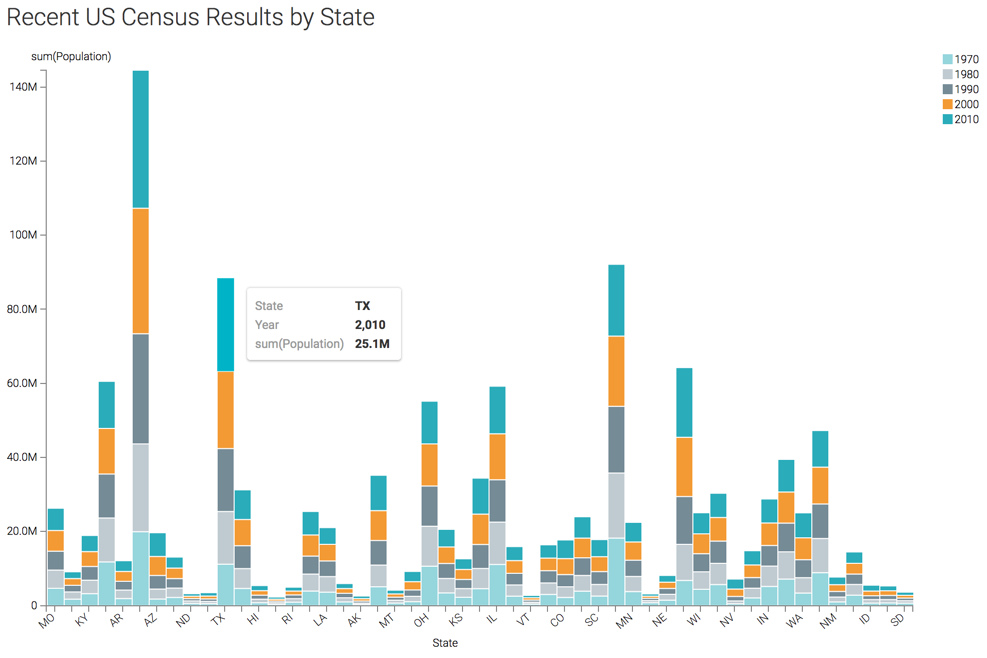
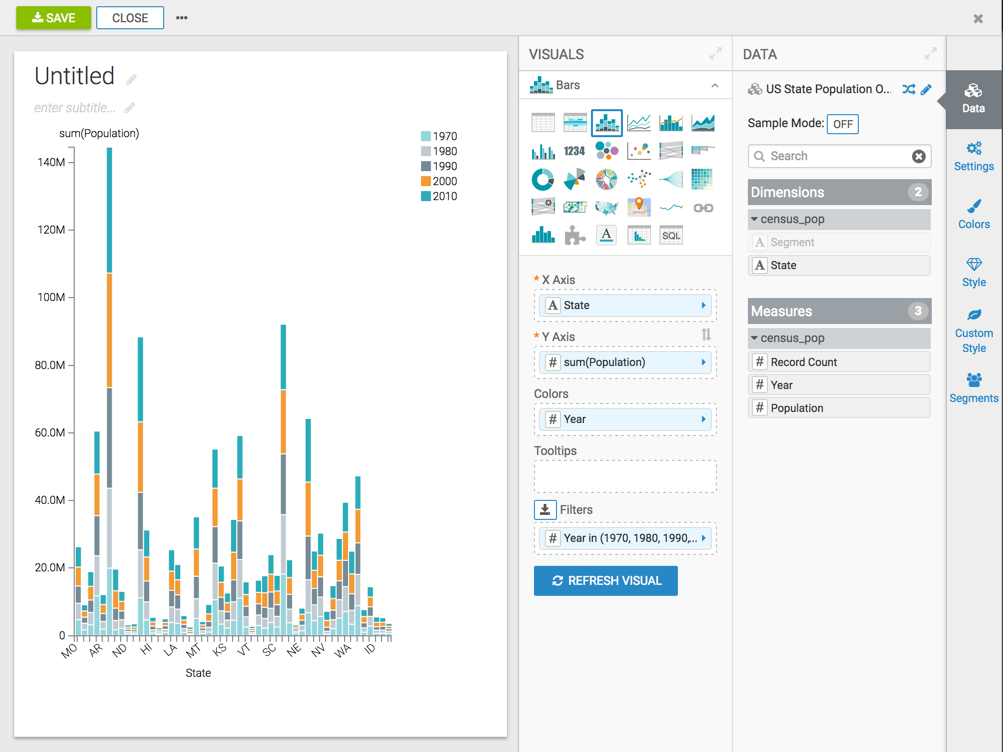
- Choose a different visual type. We chose Bars in this example.
-
Populate the shelves from the available Dimensions and Measures fields:
- Place the dimension state on the X Axis shelf.
- Place the measure population on the Y
Axis shelf. Notice that it appears with its default aggregation, as
sum(population). - Place the measure year on the Colors shelf.
- Place the measure year on the Filters
shelf. The Filter for year module opens automatically; select the
years
1970,1980,1990,2000, and2010, and click Apply.
- Click Refresh Visual.
Note the appearance of the visual.
- Change the title to
Recent US Census Results by State.-
Click (pencil icon) next to the title of the visualization to edit it, and enter the new name.
[Optional] Click (pencil icon) below the title of the visualization to add a brief description of the visual.
-
At the top left corner of the Visual Designer, click Save.
At the top left corner of the Visual Designer, click Close.
You can now see the visual as it would appear in run-time environments.