Creating Calculated Fields
Sometimes, the data in the base tables cannot be used directly, and must use an expression to change or "correct" it. For other use cases, you can create a calculation based on one or more fields. Instead of adding these expression for every visual, Arcadia Enterprise enables you to create new fields at the level of the dataset; they can then be used in visuals and dashboards, just the same as native data fields.
gdp (gross
domenstic product) in the dataset World Life Expectancy [data source
samples.world_life_expectancy]. We define it by the following
equation:gdp = gdp_per_capita x populationOn the main navigation bar, click Data.

The Data view appears, open on the Datasets tab.
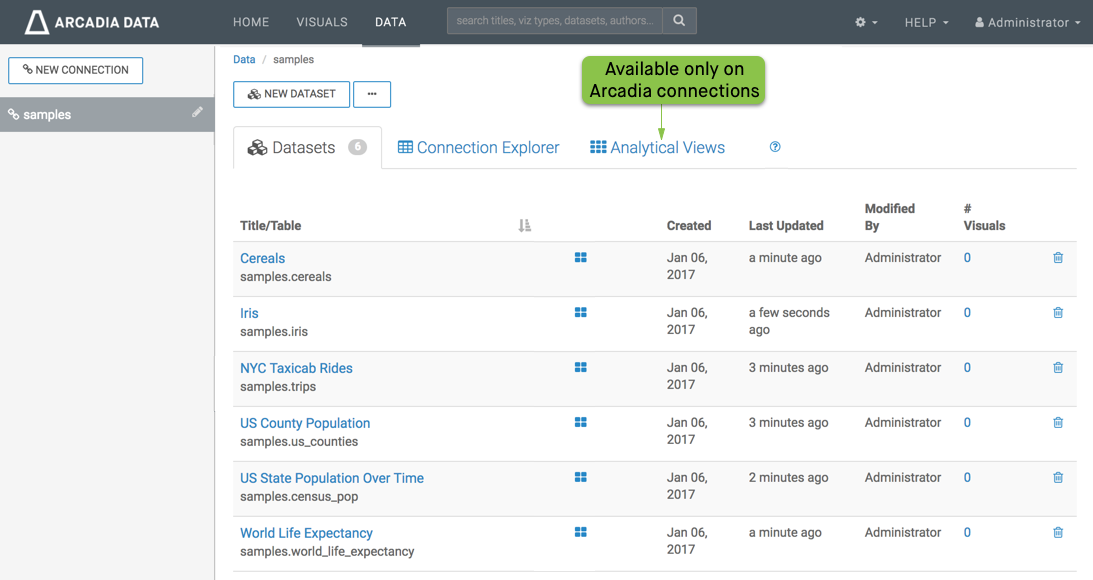
- In the left navigation menu, click samples.
-
In the Datasets area, select World Life Expectancy
(samples.world_life_expectancy).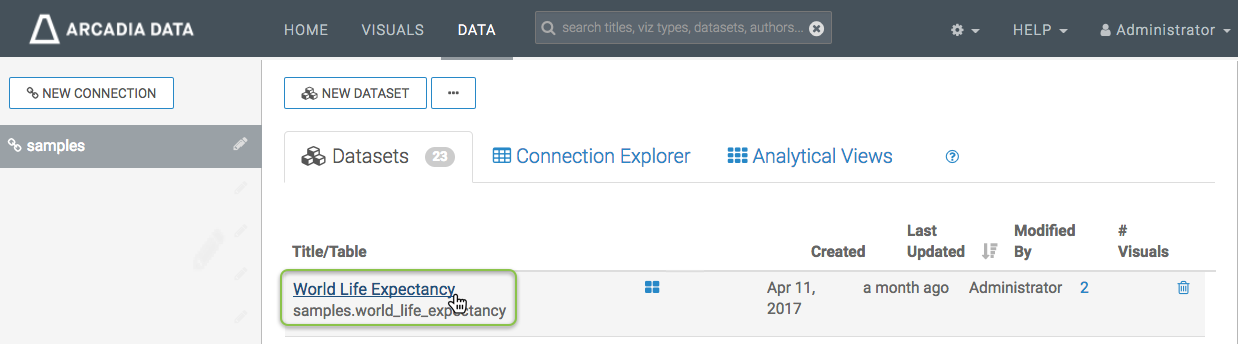
Selecting Dataset 'World Life Expectancy' -
In the Dataset Detail menu, select Fields.
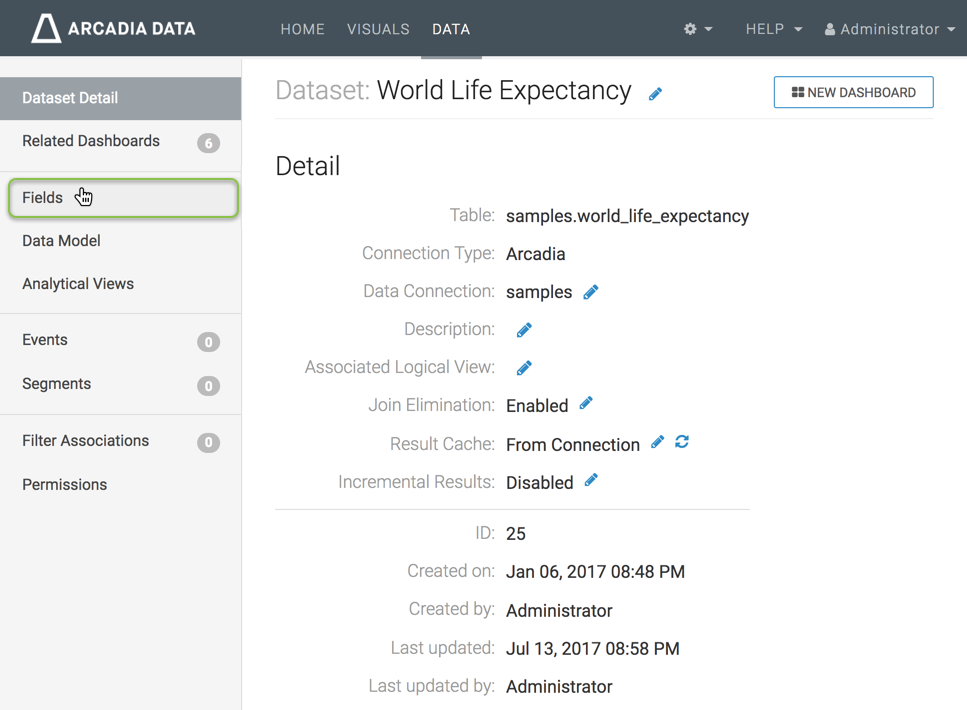
Dataset Detail for 'World Life Expectancy' -
In the Fields interface, select Edit Field.
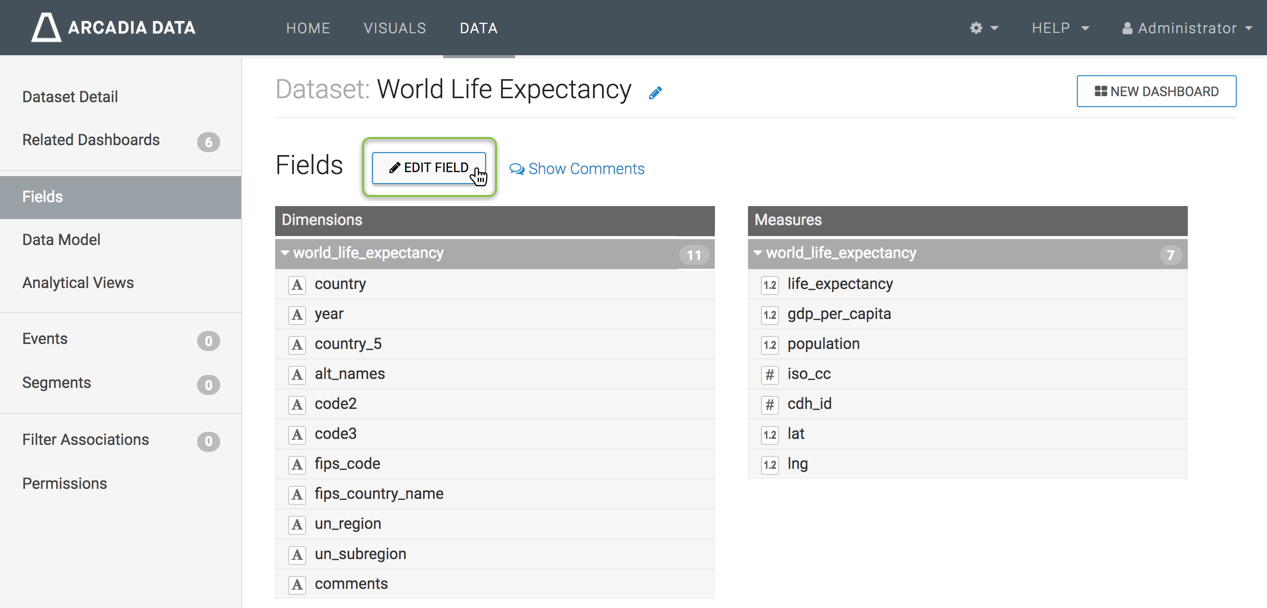
Editing the Fields of Dataset 'World Life Expectancy' -
Under Measures, find the field
gdp_per_capita, and click the (down arrow) icon on its right side.From the menu, select Clone.
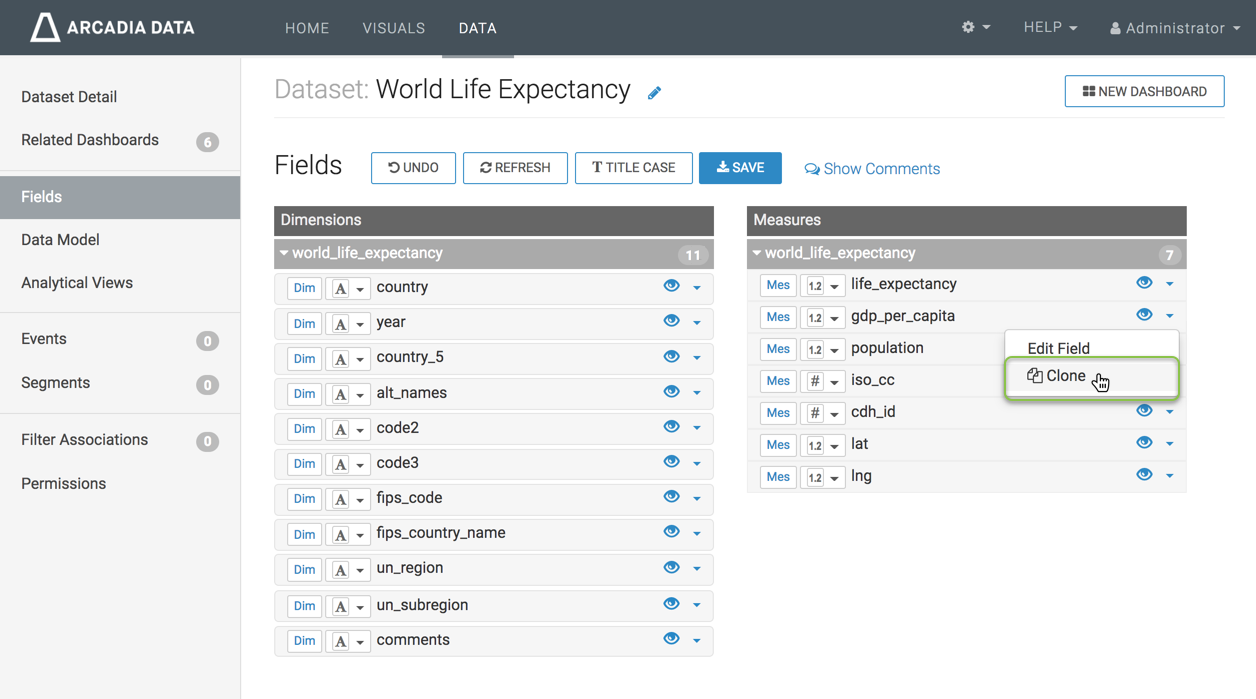
Cloning a Field of a Dataset -
Under Measures, find the new cloned field
Copy of
            gdp_per_capita
, click the (down arrow) icon on its right side, and select Edit Fields.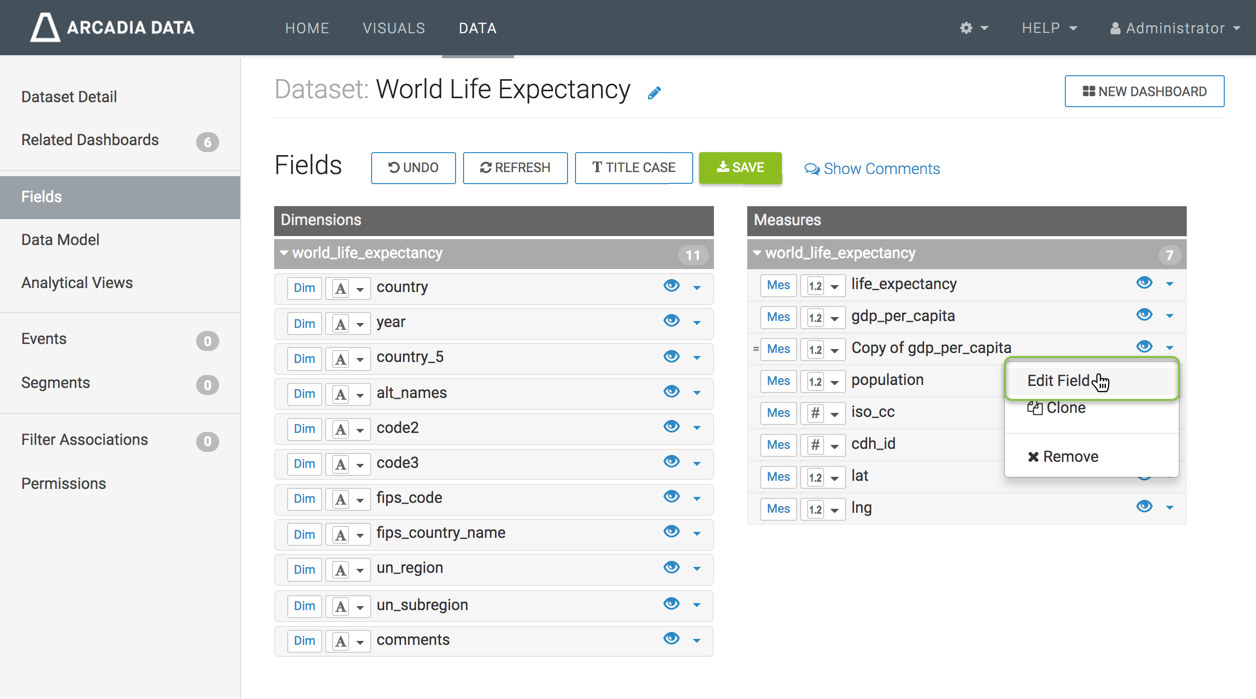
Editing a Cloned Field of a Dataset The Edit Field Parameters window modal appears.
-
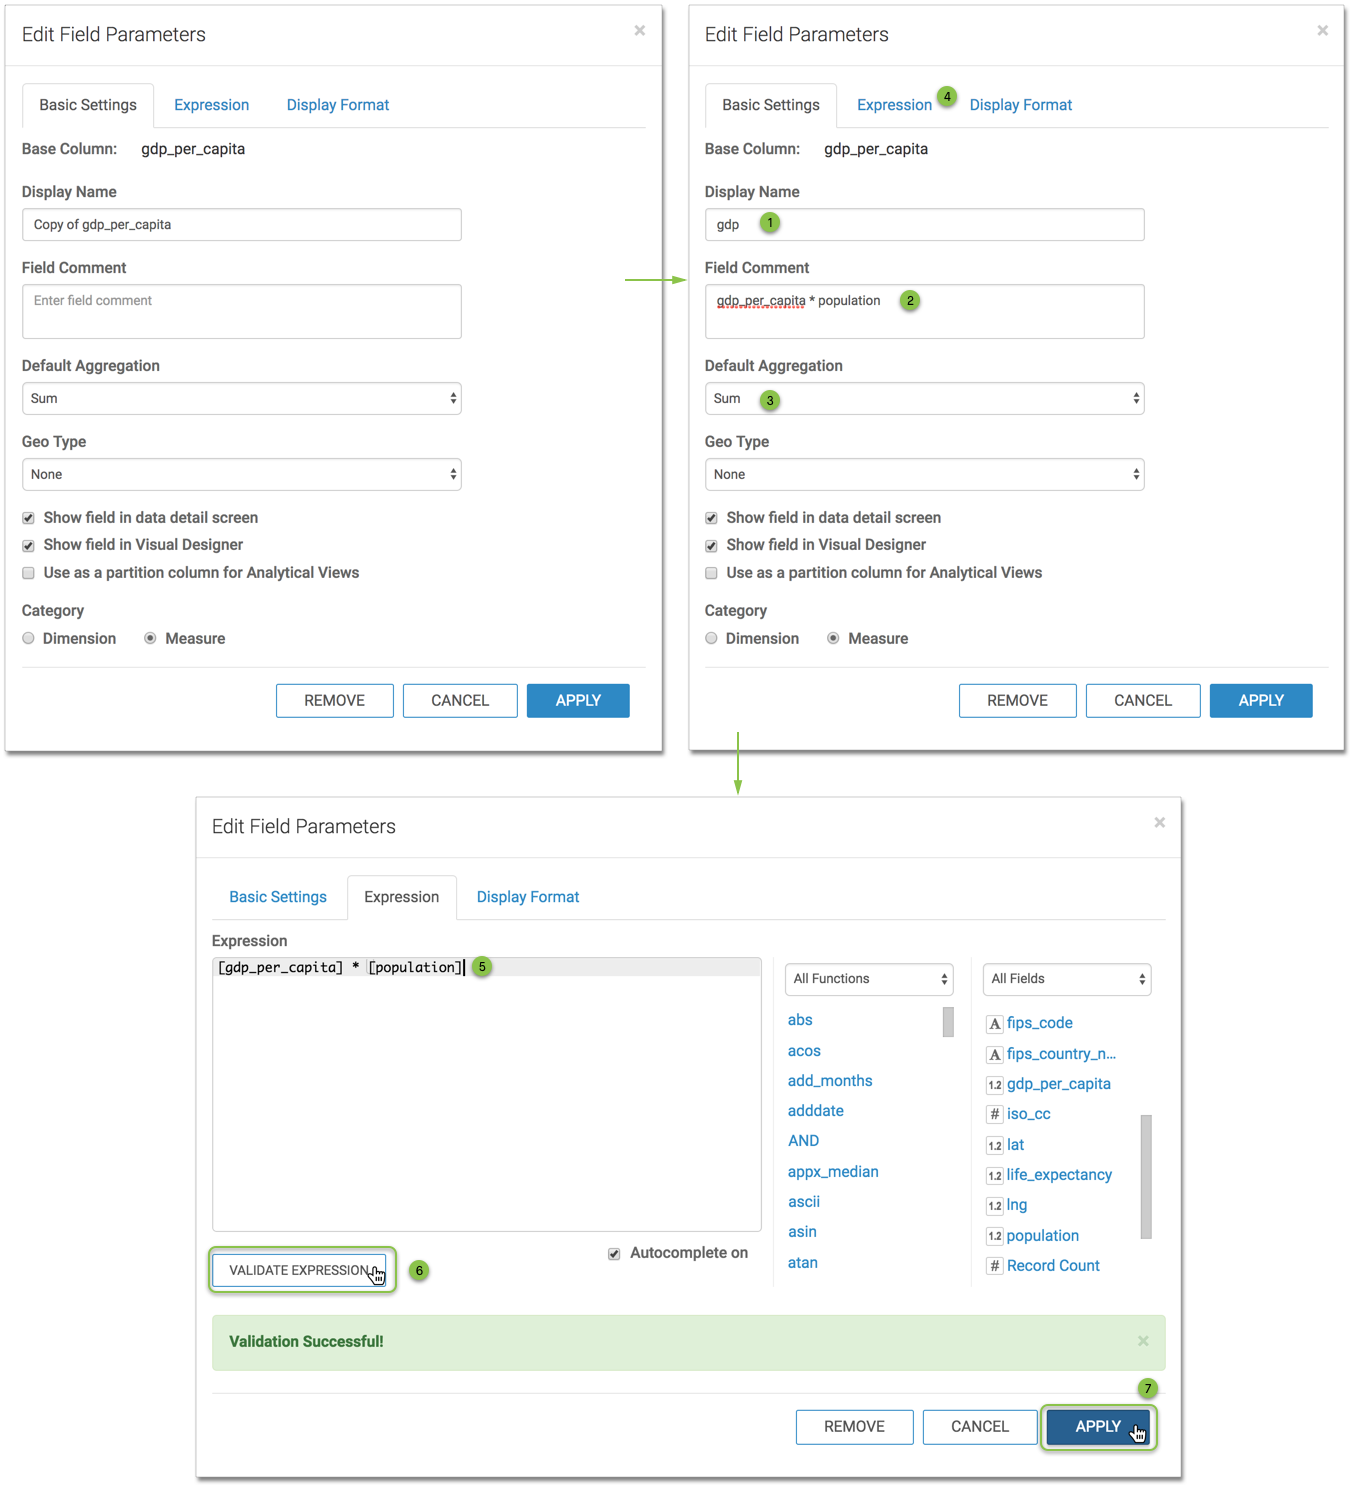
The Edit Field Parameters modal supports three primary methods of editing fields; they match the three tabs of the modal: Basic, Expression, and Display Format.
In the Edit Field Parameters modal, under the Basic tab, make the following changes:
- Change Display Name to
gdp. - Add Field Comment
gdp_per_capita * population. - Ensure that the Default Aggregation is
Sum. - Click Edit Expression tab.
- Change Expression to
[gdp_per-capita] *
              [population]
. - Click Validate Expression to ensure that the calculation works.
- When the Validation Successful message appears on the modal, click Apply.
Saving Changed Field Definition - Change Display Name to
-
Notice that the new calculated field has an equal sign notation, =.
Under Dataset: World Life Expectancy, click Save.
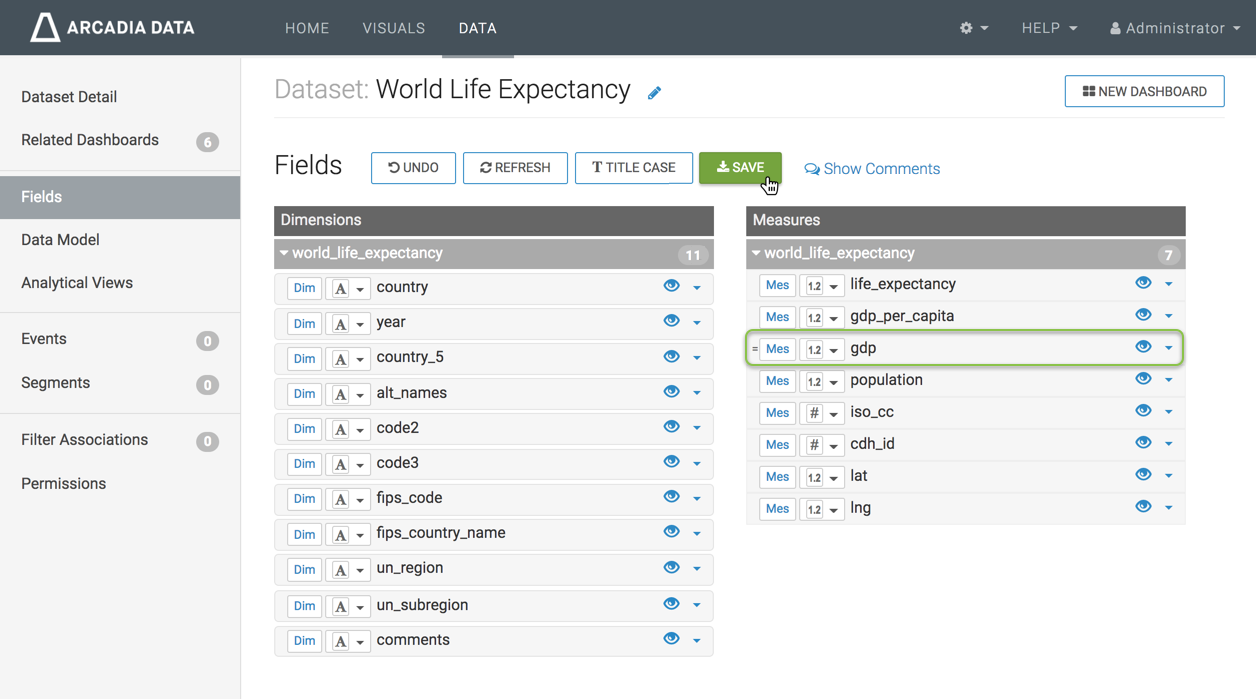
Saving Changed Field Definition
Testing the Calculated Field
To test that the new calculated field works correctly, follow these steps:
-
Click New Dashboard in the top left corner of this interface.
-
In the new dashboard, click New Visual.
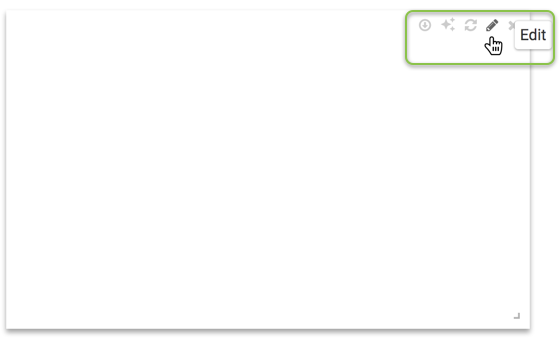
Hover over the top right corner of the visual, and click the (pencil/edit) icon.
Saving Changed Field Definition -
In the Select the Combo visual type, and populate the shelves from the available fields (Dimensions, Measures, and so on) in the Data menu.
- Under Dimensions, select
country, and place it on the Dimensions shelf. - Under Dimensions, select
year, and place it on the Filters shelf. In the Filter for year modal window, under the Value tab, select the year2010. - Under Dimensions, select
un_region, and place it on the Filters shelf. In the Filter for un_region modal window, under the Value tab, selectEurope. - Under Measures, select
gdp_per_capita, and place it on the Bar Measure shelf. -
Under Measures, select
gdp, and place it on the Line Measure shelf.Click the (down arrow) on
GDPfield, and in the Field Properties, under Axis, select Secondary Axis.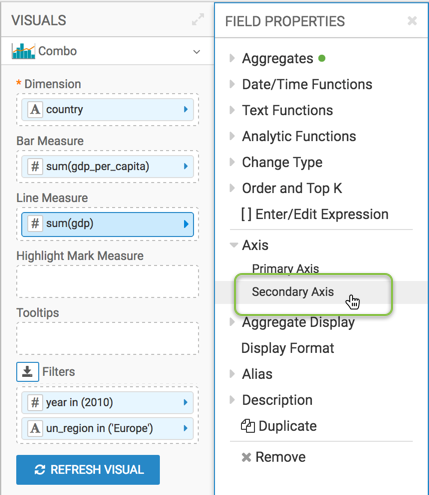
Applying Secondary Axis
Click Refresh Visual.
- Under Dimensions, select
-
As you can see, the two measurements appear on the graph, superimposed on each other: the original
gdp_per_capitarepresented by the bars, and the calculatedgdp, represented by the line.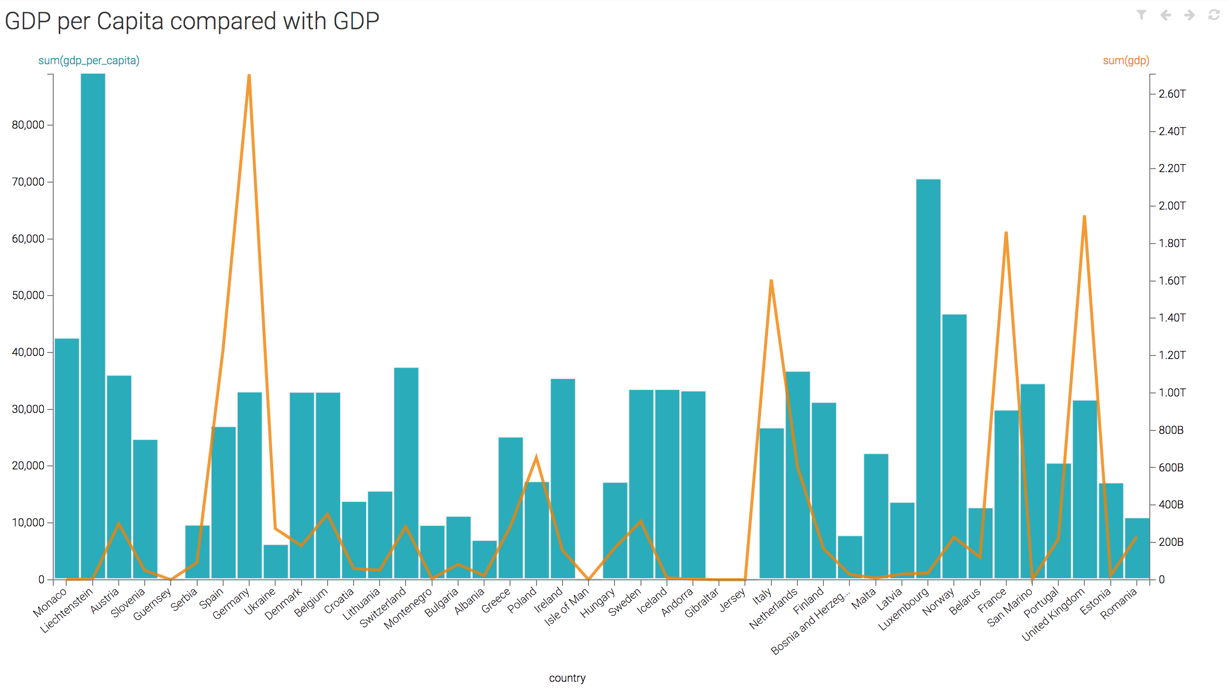
Visual Uses a Calculated Field