Javascript Custom Styles
To define styling for the entire site using Javascript (JS) code, follow these steps:
- Click the (gear) icon at the top menu to open the Site Administration menu, and select Custom Styles. See Defining Site-Wide Custom Styles.
- In the Manage Custom Styles interface, click New Custom Style, and then select the Javascript tab.
- [Optional] If you enable the Autocomplete on option, and then
typearc, a list of Arcadia-specific APIs appears, such as
arcapi.settings,arcapi.getSettings,arcapi.sendParameters,arcapi.getParameters, and so on.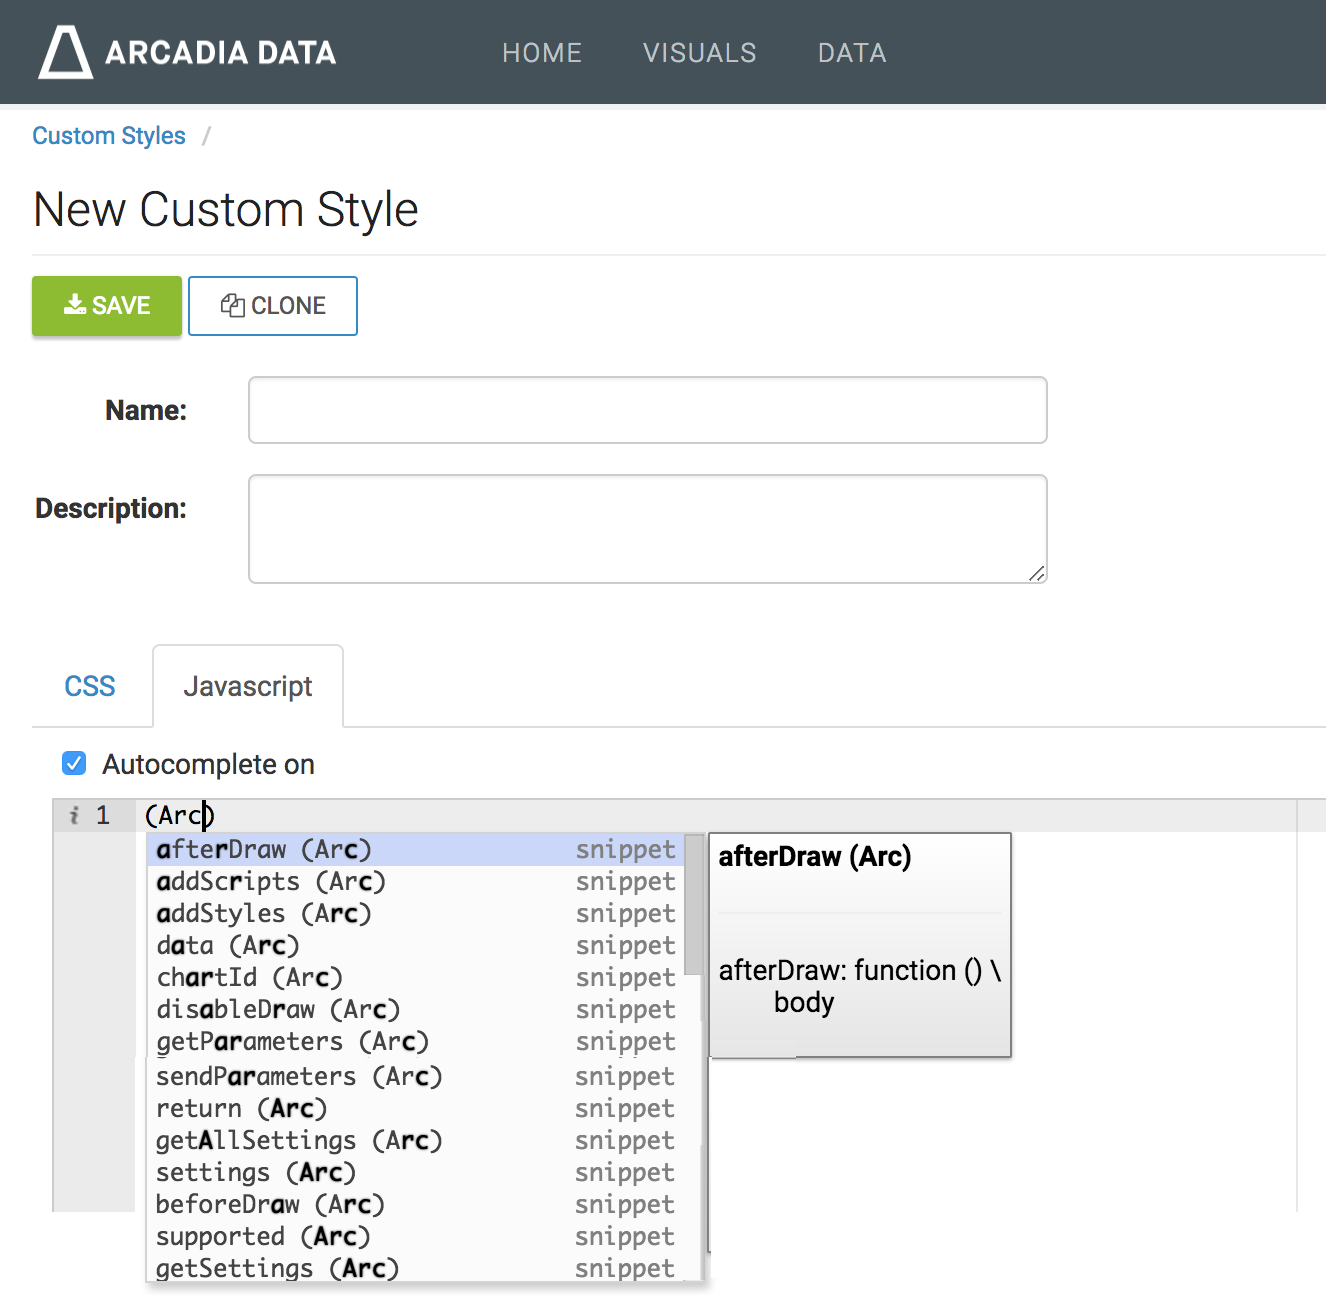
Enable 'Autocomplete on' option and Select JavaScript Functions Under Name, enter
Pie Chart Labels.You may enter the Description of the custom style, too.
-
Under the Javascript tab, add the following code:
return function() {
    var f = function() {};
    f.version = "1";
    f.settings = function() {
        return [
            {
                id: 'Square Size',
                defaultValue: '10',
            },
        ];
    };
    f.beforeDraw = function() {
        var rows = arcapi.dataResult().rows();
        rows.map(function (r) {
            if (r[0].toLowerCase() === 'other') {
                r[0] = 'Not Applicable';
            }
        });
        arcapi.dataResult().rows(rows);
    };
    f.afterDraw = function() {
        var rows = arcapi.dataResult().rows();
        var length = $('#' + arcapi.chartId() + ' .viz-base-legend-g').children('text').length;
        var total = d3.sum(rows, function(row) { return +row[1]; });
        var legendlabel;
        var fmt = d3.format(",");

        rows.forEach(function(d, i) {
            for (var c=0; c < length; c++ ){
                legendlabel = $('#' + arcapi.chartId() + ' .viz-base-legend-g text')[c].innerHTML;
                if(legendlabel == d[0]){
                   $('#' + arcapi.chartId() + ' .viz-base-legend-g text')[c].innerHTML = legendlabel + ' (' + fmt(+d[1]) + ')';
                }
            }
        });
    };
    return f;
}();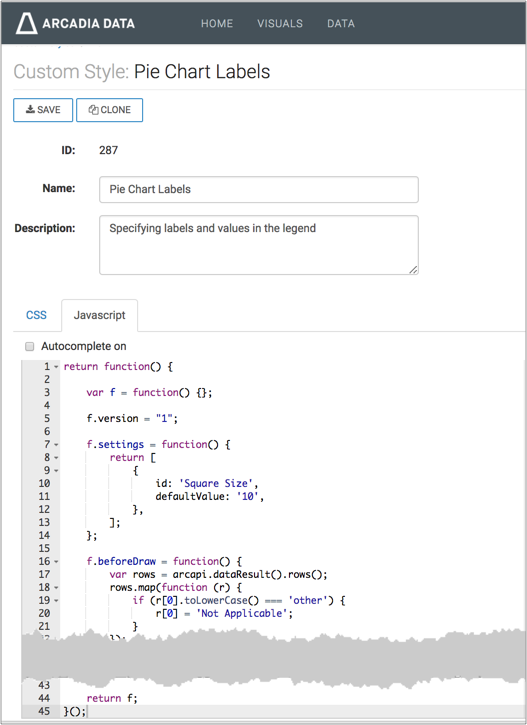
Defining a New Custom Style - Click Save.
-
This image shows the pie chart before applying the javascript code. Notice that the legend in the pie chart does not show values. Also, one of the labels is named Other.
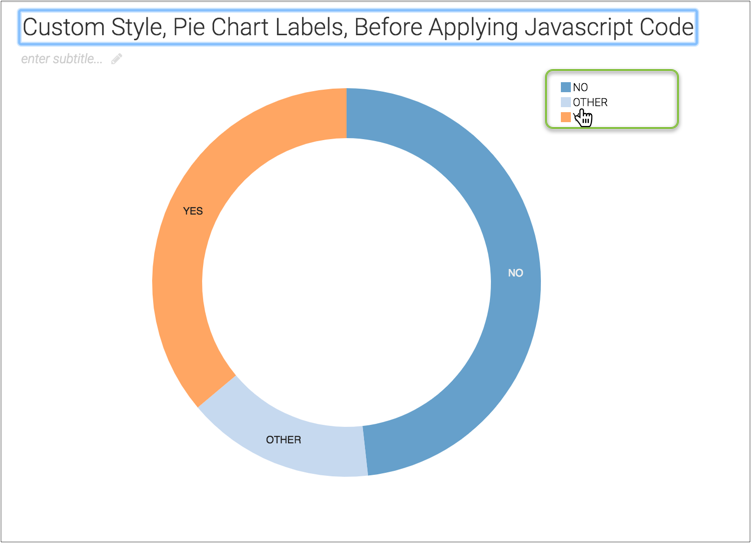
Custom Style 'Pie Chart Label' Before Applying JavaScript Code -
This image shows the pie chart after applying the javascript code. Notice that the legend in the pie chart now shows the values. Also, the second label name is renamed; it is now Not Applicable instead of Others.
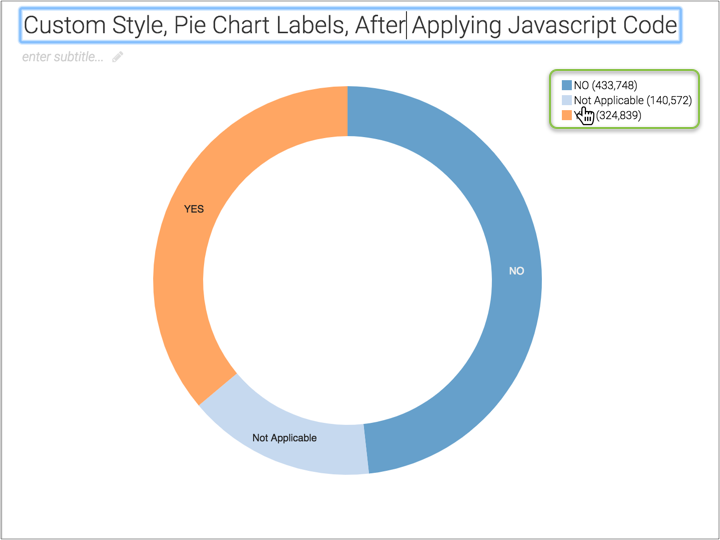
'Pie Chart Label' Custom Style After Applying Javascript Code -
Note that the Custom Styles interface keeps track of all visuals that use each defined style.
Here, you can see that the Custom Styles interface lists the new style, Pie Chart Labels, and that it applies to visualization with ID 6700. Note also that this ID is an active link to the visualization.
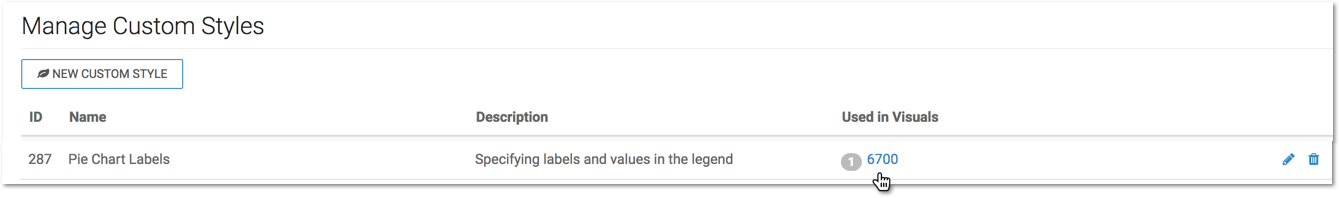
Manage Custom Styles Shows the Number and Address of Visuals that Use the Custom Style