Adding Visuals to a Sheet
The following steps demonstrate how to add visuals to a sheet in an Arcadia Enterprise dashboard.
-
Open a dashboard of your choice in Edit mode.
-
Choose a sheet in the dashboard where you plan to add visuals. We are working with a new sheet Low GDP, which we started in Creating New Sheets.
By default, each new dashboard contains a single sheet.
-
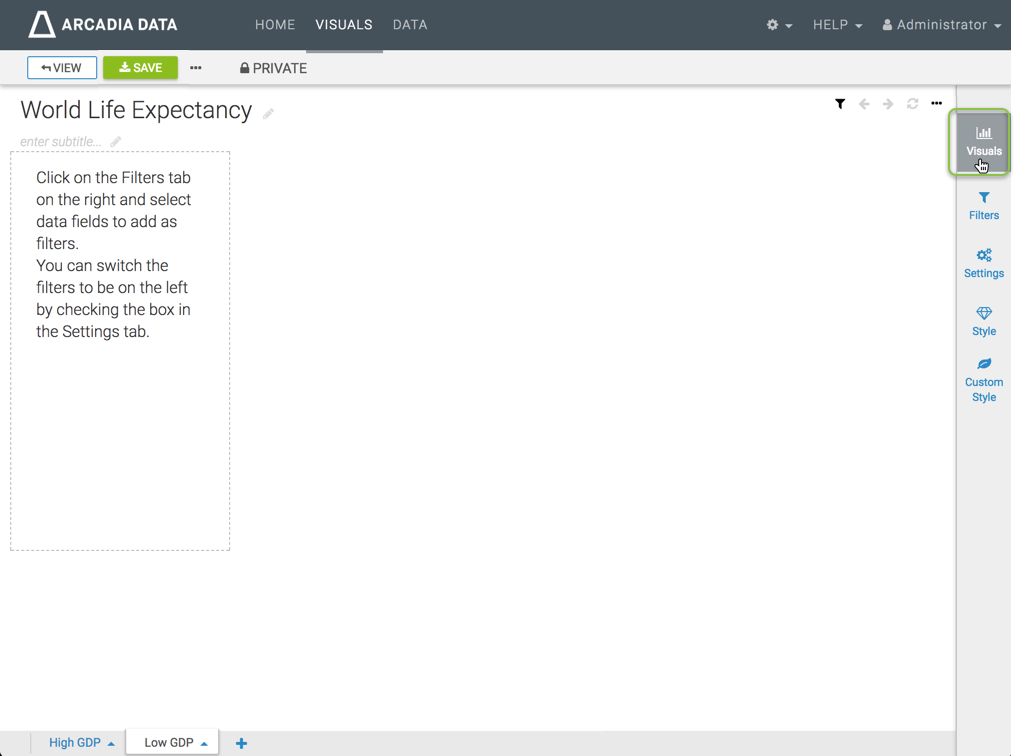
In the menu on the right, select Visuals.
-
In the Visuals menu, you have six configurable options:
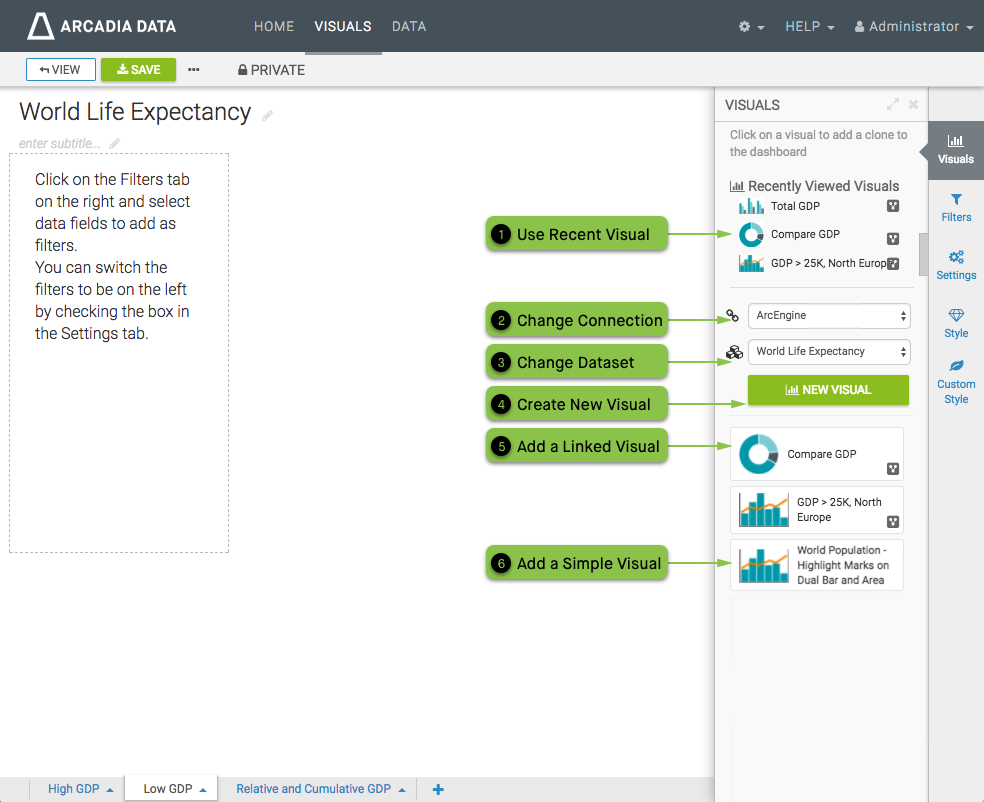
- Recently Viewed Visuals
Simply click on one of the options in the top menu to add a visual to the dashboard sheet.
-
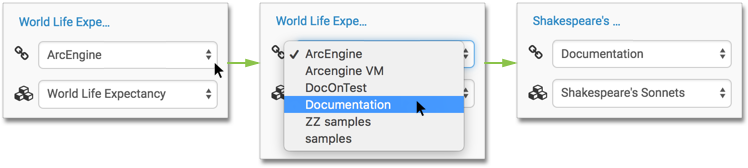
Change Connection
Because Arcadia Enterprise supports access to multiple data sources in the same dashboard, you can change the connection to access visuals based on different connections and dataset.
Click the name of the current connection, and select a different connection from the menu. When you change the connection, note that it changes the dataset to the first one that is available on that connection. This also updates the list of visuals that appear on the lower portion of the menu.
-
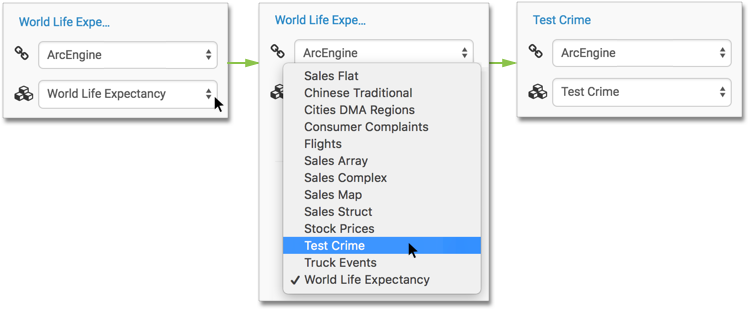
Change Dataset
Similarly to changing the connection, you can change the source dataset of the visuals that you plan to add to your dashboard sheet. The new dataset may be on the same connection, or on a different connection.
Click the name of the current dataset, and select a different dataset from the menu. This also updates the list of visuals that appear on the lower portion of the menu.
- Create a New Visual
This creates a new table visual based on the chosen dataset. You would subsequently open this visual in edit mode and make changes by selecting another option from the visual catalog (such as line, area, gauge, and so on), populating the shelves of the visual, customizing settings, colors, and so on.
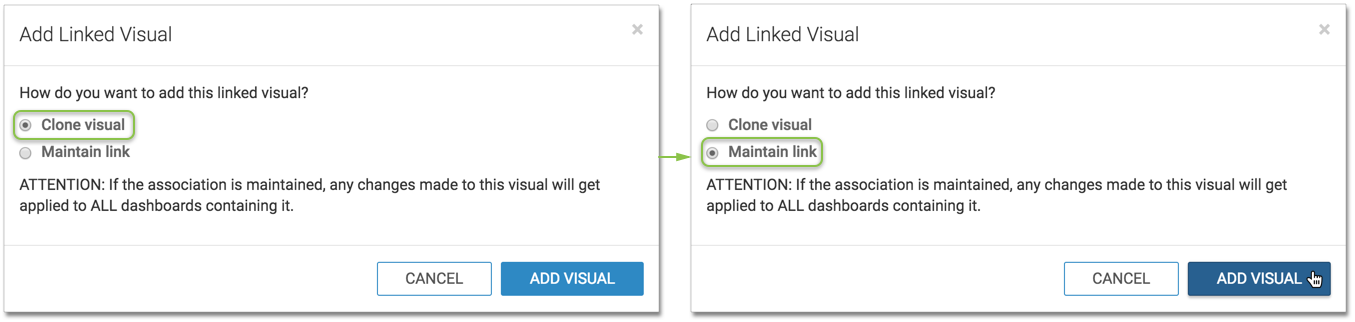
- Add a Linked Visual
This option allows you to reuse an existing visual that has been previously marked as linked. After you click to select a visual that is marked with the linked symbol, , Arcadia Enterprise opens an Add Linked Visual modal window. Choose one of the following options:
- Clone visual option, the default, makes a copy of the linked visual. This new visual can be subsequently changed without affecting the original visual.
- Maintain link option keeps the association; any changes made to the visual in one dashboard appear in all dashboards that feature this same visual.
After making your choice, click Add Visual.
- Add a Visual
To add a visual that already exists in this dashboard and appears on another sheet, simply click on the icon that represents this visual.
- Recently Viewed Visuals
-
Click Save to save all changes to the sheet.
- To further enhance the dashboard sheet, add filters, as described in Adding Filters to a Sheet.