Activity Log
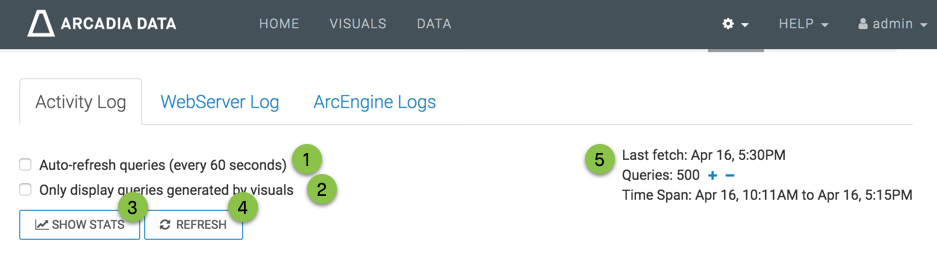
In the Arcadia Enterprise Activity Log interface, note the following features that are common to both the List View and Statistical View of this interface:
-
Auto-Refresh queries
When you select this option, it automatically refreshes the information in this interface at regular intervals.
The default refresh time interval is 60 seconds.
-
Only display queries generated by visuals
This option limits reporting to actions on visuals.
This means that logs do not report actions on datasets, connections, and analytical views.
- Show Stats / Hide Stats
The Show Stats / Hide Stats option toggles between showing or hiding statistics on activity logging.
- Refresh
The Refresh option starts off the refresh operation, not waiting for the auto-refresh.
At the top right, the interface has the following options:
- Last fetch
This captures the timestamp at the time that the query was generated, such as April 16, 5:30 PM.
Note the Refresh options.
- Queries
This shows the number of queries reported.
By default, this number is 500.
Clicking on the (plus) icon increases the number of queries by increments of 500.
Clicking on the (minus) icon reduces the number of queries by increments of 500.
- Time Span
This reports the time interval covered by the log, such as Apr 16, 10:11 AM to Apr 16, 6:00 PM.
- Last fetch
For details of each activity, see List View of Activity Log.
For a summary of activities by type, see Statistical View of Activity Log.