Drill Down and Drill Up Data Discovery
To discover your data, you can navigate up and down the hierarchical tree.
The following conditions apply to Drill Down/Up functionality:
-
This feature is only available on dimensions that are part of predefined hierarchies. See Creating New Dimension Hierarchies.
-
These hierarchies may only be defined by users with administrative privileges, and at the level of the dataset.
-
Hierarchies, as implied, combine related and 'nested' dimensions of the dataset, progressing from largest to smallest measurement.
-
Dimensional hierarchies by their very nature do not help discover how potentially unrelated dimensions influence the results. For this, we encourage you to read the article on Drill Into Data Discovery.
To use this feature, here are examples for bar charts. We constructed them by Creating New Dimension Hierarchies, and setting up the visual World
Population - Hierarchy, as described in Dimension Hierarchies.
- Drill Down by clicking on the bar label for a value.
- Drill Up by clicking on the axis label.
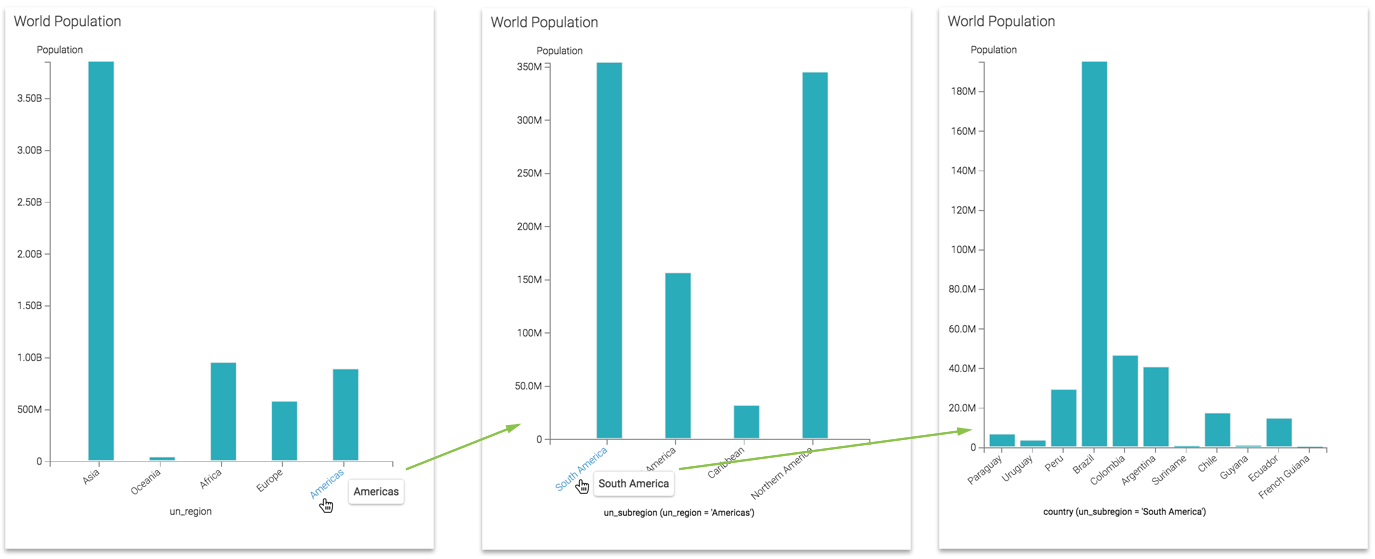
Drill Down
To use Drill Down, place the pointer over one of the data labels along the horizontal axis, and note that it changes color; this is because the data labels are link-enabled. Click on the label to drill down to a lower level of the hierarchy.
In the following graphic, we drilled through these levels:
- Level 1:
un_region = 'Americas' - Level 2:
un_subregion = 'South America' - Level 3:
country
Note that every time you move down a hierarchy level, the scale of the vertical axis adjusts automatically.
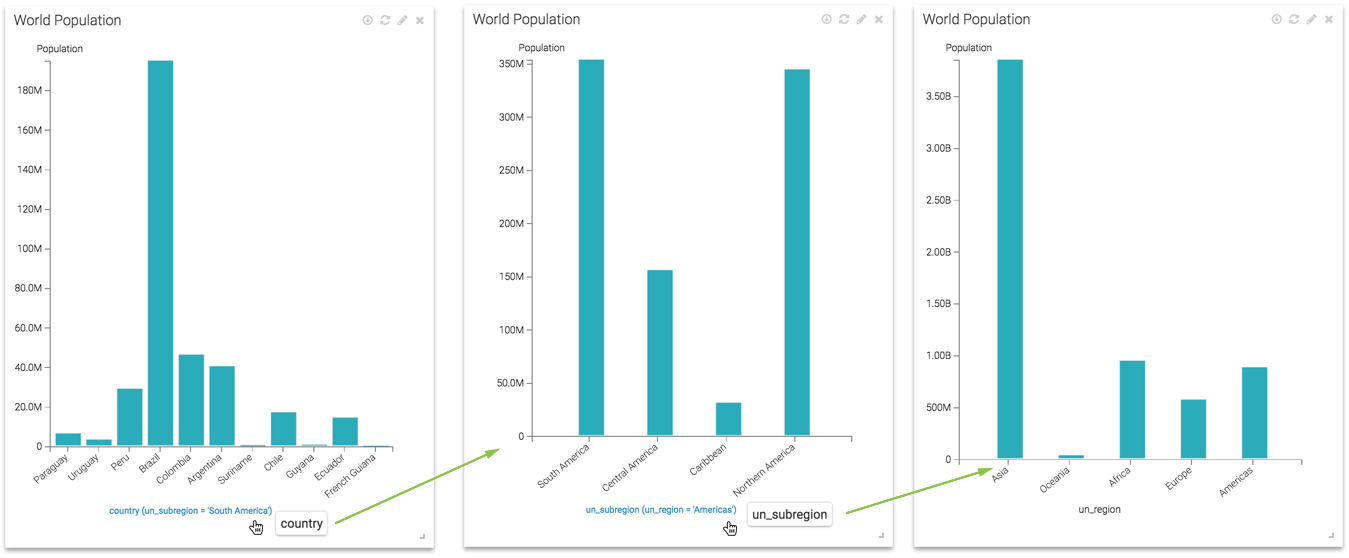
Drill Up
To use Drill Up, place the pointer over the label of the horizontal axis itself, and note that it changes color; it is also link-enabled. Click the horizontal axis label to go up the hierarchy levels.In the following graphic, we moved up along these levels:
- Level 3:
countrywhereun_region = 'America'andun_subregion = 'South America' - Level 2:
un_subregion = 'South America'whereun_region = 'America' - Level 1:
un_region
Note that every time you move up a hierarchy level, the scale of the vertical axis adjusts automatically.