Latitude and Longitude Map with Bubbles
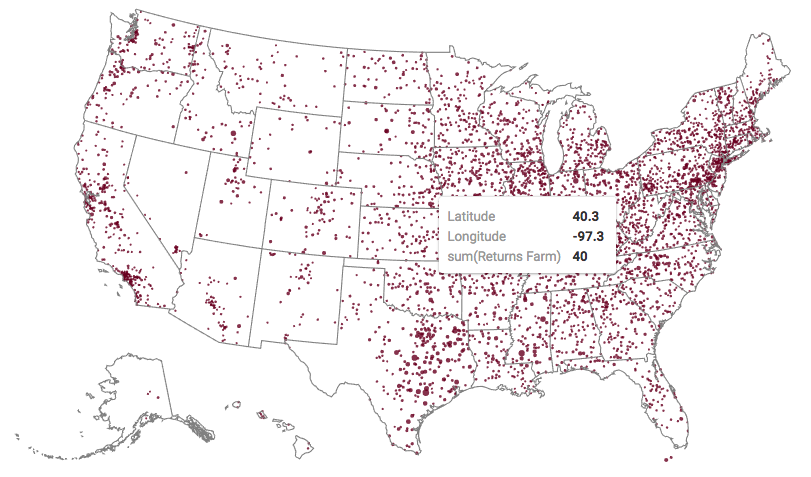
A geographic coordinate map of the United States, based on degrees of latitude and longitude, shows a comparison of measurement values across US States.
The following steps extend the work completed in US Zipcode Map with Bubbles,
and demonstrate how to create a map visual on the dataset Income Tax Returns. It
produces maps with bubble marks that correspond to the relative size of the measurement at
each latitude and longitude pair.
Supplement the dataset by uploading the datafiles us_regions.csv and zipcode-lat-long.csv into your database, and making simple joins
between income_tax_2014_zipcode.state and us_regions.state,
and between income_tax_2014_zipcode.zipcode and
zipcode_lat_long.zipcode. See Data Model: Joins.
- Clone the
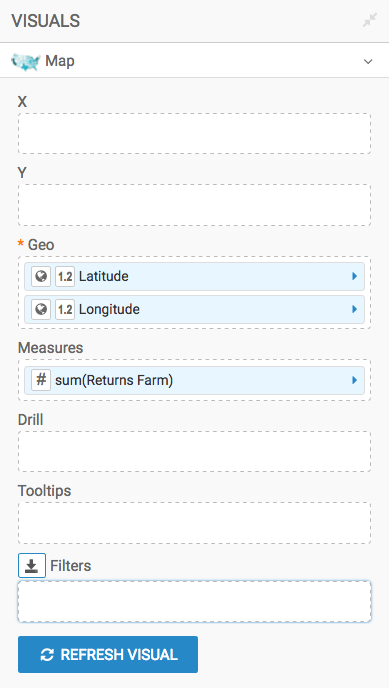
Income Tax Returns - Zipcodevisual. The clone opens in Edit mode. - Change the field setup on the shelves:
- Remove all the fields from the Filters shelf.
- Remove the field
Zipcodefrom the Geo shelf. - In the Data menu, enter the term "latitude" in the
Search box, and then add the field
Latitudeto the Geo shelf. - Search for term "longitude", and add the field
Longitudeto the Geo shelf.
- Open the Settings menu, expand the
Map menu, and select the
United SatesMap View option. See Map View. -
Click Refresh Visual.
The map visual appears. You can move the visual (pan), zoom in and out, and see the details in the Tooltips text.
-
Click (pencil icon) next to the title of the visualization to edit it, and enter the new name.
- Change the title to
Income Tax Returns - Lat and Long. At the top left corner of the Visual Designer, click Save.