SQL Query Visuals
The query visual enables you to process SQL language queries using an enhanced visual editor for SQL authoring, including autocomplete.
We are working with dataset US County Population [data source
samples.us_counties].
- Start a new visual based on dataset
US County Population[data sourcesamples.us_counties]; see Creating Visuals. -
In the visuals menu, find and click queries.
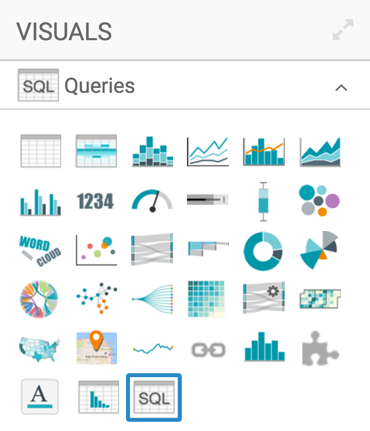
-
Note that the shelves of the visual changed. There is only one 'shelf': a large text box for entering the SQL statement.
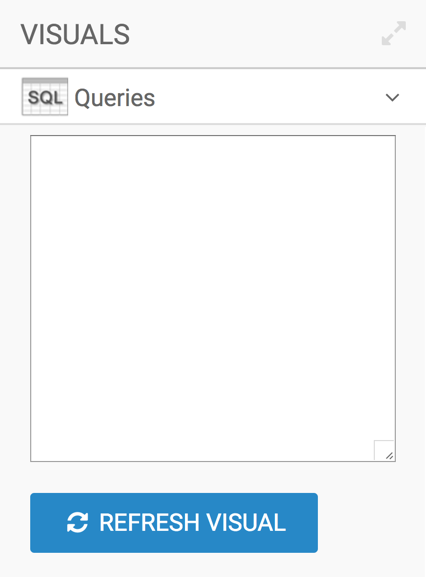
-
In the Enter/Edit SQL Expression modal window, enter the following text:
SELECT
    TA_0.`stname` as `State`,
    TA_0.`ctyname` as `County`,
    (sum((TA_0.`wa_male`))+sum((TA_0.`wa_female`))) as `White`,
    (sum((TA_0.`ba_male`))+sum((TA_0.`ba_female`))) as `Black or African American`,
    (sum((TA_0.`ia_male`))+sum((TA_0.`ia_female`))) as `American Indian and Alaska Native`,
    (sum((TA_0.`aa_male`))+sum((TA_0.`aa_female`))) as `Asian`,
    (sum((TA_0.`na_male`))+sum((TA_0.`na_female`))) as `Native Hawaiian and Other Pacific Islander`,
    (sum((TA_0.`tom_male`))+sum((TA_0.`tom_female`))) as `Two or More Races`,
    sum((TA_0.`tot_pop`)) as `Total Population`
  FROM `samples`.`us_counties` TA_0
  GROUP BY 1, 2
  LIMIT 5000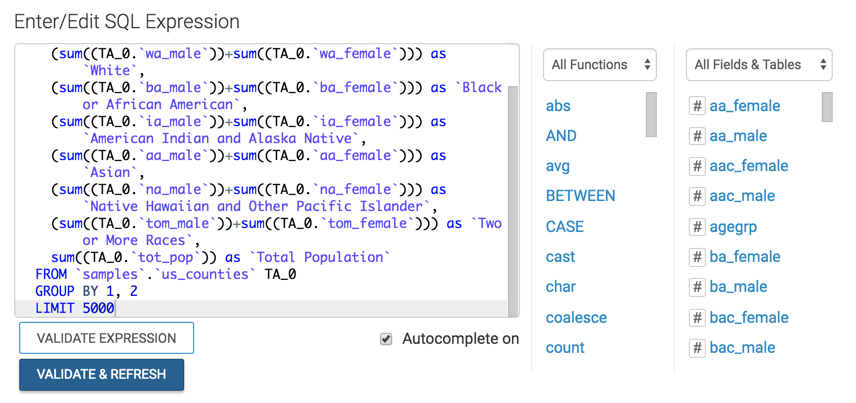
-
Click Validate & Refresh.
-
Change the title to
County Populations, by State /County - Query.-
Click (pencil icon) next to the title of the visualization to edit it, and enter the new name.
[Optional] Click (pencil icon) below the title of the visualization to add a brief description of the visual.
-
At the top left corner of the Visual Designer, click Save.

At the top left corner of the Visual Designer, click Close.
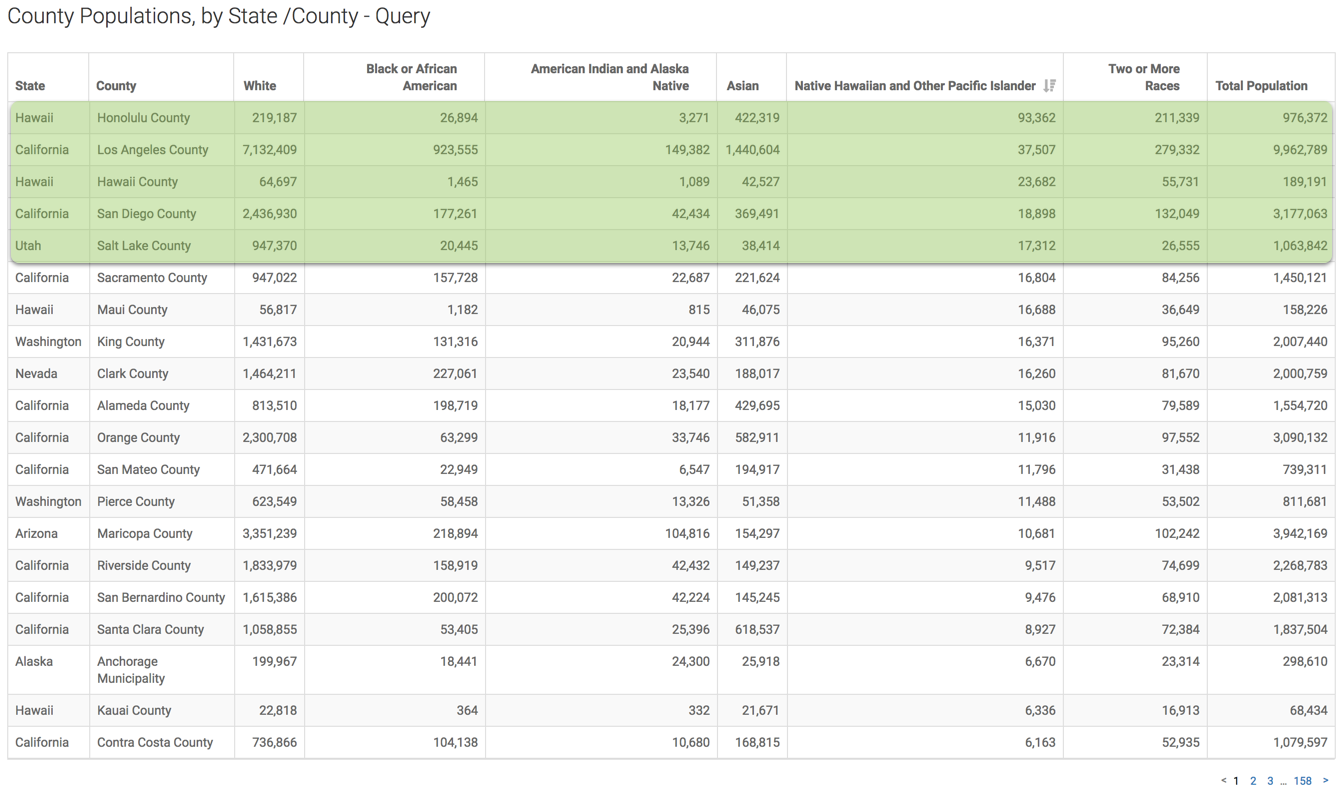
Note the appearance of the table created from the query:
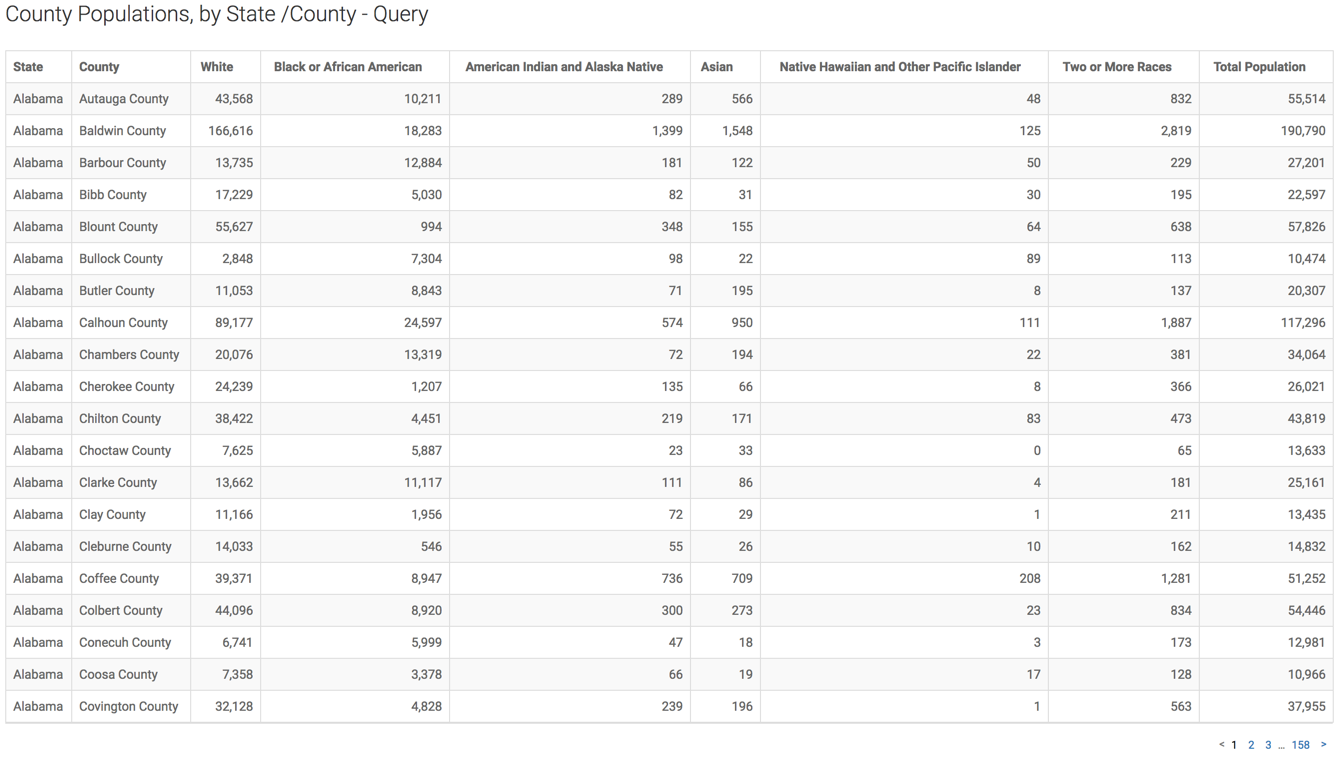
As an example of using this visual, sort on the column Native Hawaiian and Pacific Islander to see where most people of that ethnicity live. You may note that there is a very large population in Los Angeles, San Diego, and Salt Lake area.