Configuring Ranges on Dashboard Filters
In Arcadia Enterprise, you can easily configure real-time filters that enable you to navigate across visuals built on time series. We support both historical data and ongoing data feeds.
In this discussion, we use a dashboard with a line visual that plots stock prices and volume of sales. The filter we add uses a set of previously defined dateranges, as described in Custom Dateranges.
Follow these steps to add and configure a real-time filter on a dashboard:
-
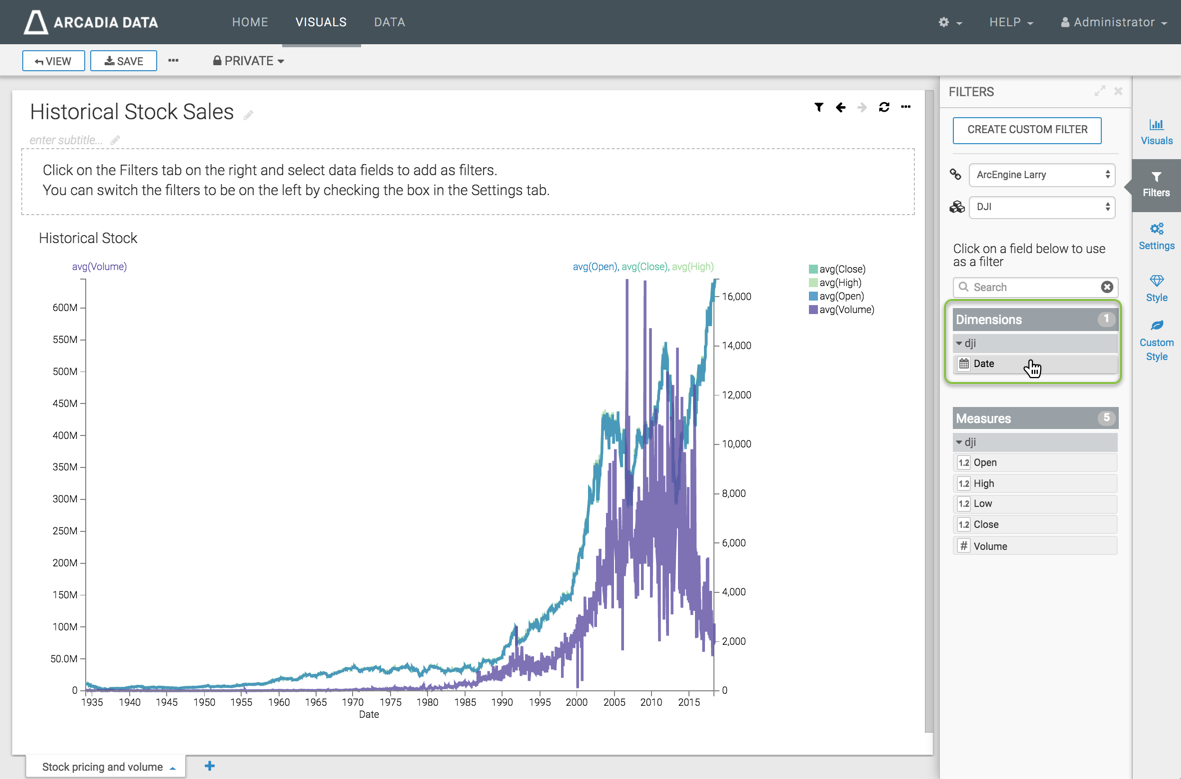
In dashboard in Edit mode, click the Filters menu on the right to open it.
-
In the open Filters menu, under Dimensions, click the Date field.
-
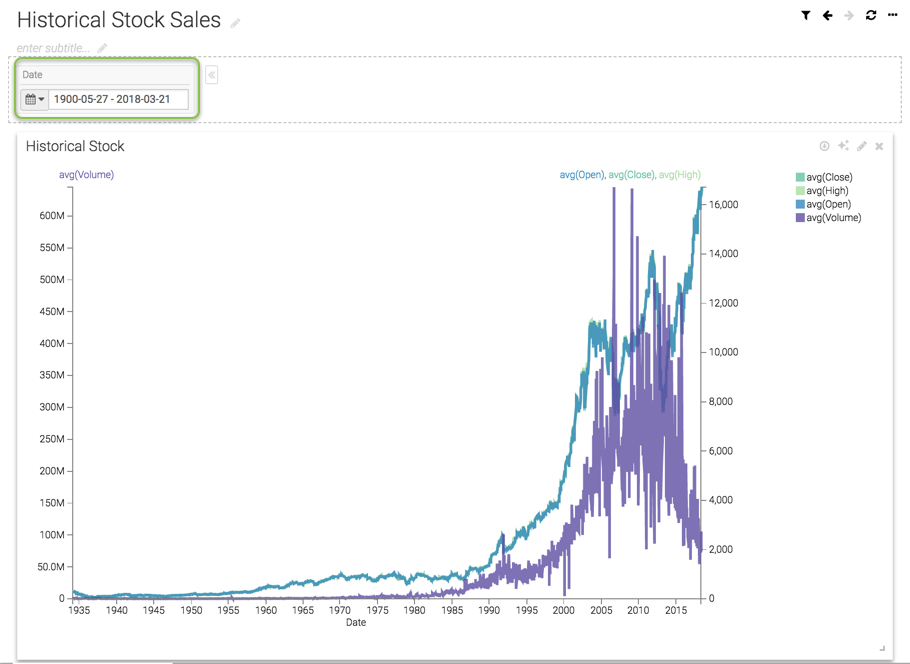
Arcadia Enterprise adds the filter Date to the filters section of the dashboard.
-
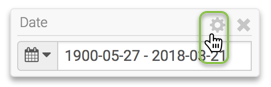
Hover over the upper right corner of the filter, and click the (gear) icon to configure the filter.
-
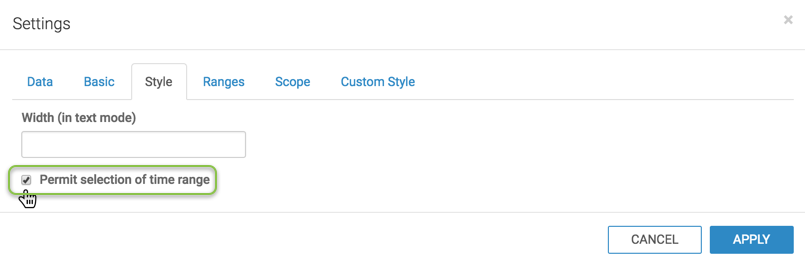
In the Settings modal window, click the Style tab, and select the option Permit selection of time range.
-
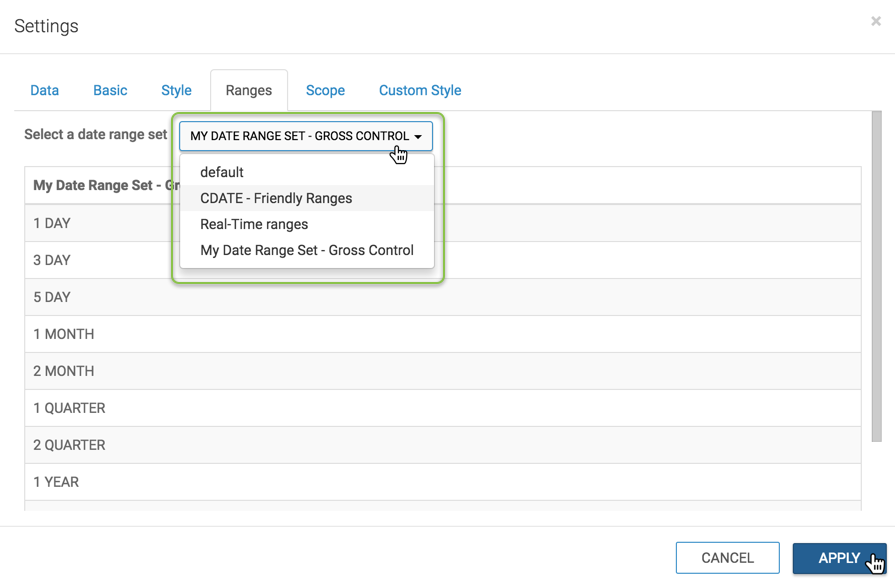
In the Settings modal window, click the Ranges tab, and select the set My Data Range Set - Gross Control.
-
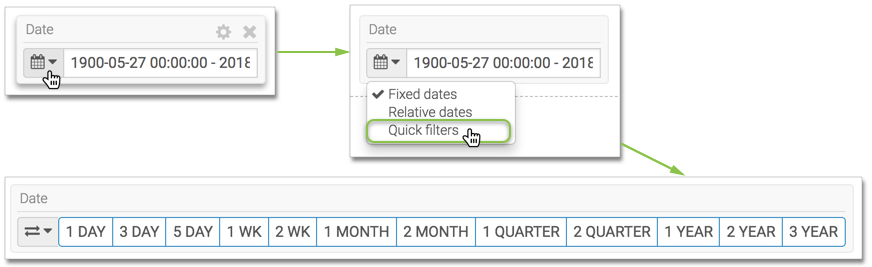
On the filter, click the (calendar) icon, and select the Quick filters option from the menu.
Note how the appearance of the filter changes, to show the set of custom dateranges.
To use the quick filter, see Using Quick Filters.