Importing Dashboards
In Arcadia Enterprise, you can import dashboards exported from another system. All you need the is appropriate JSON file that captures the definitions of these visual artifacts and all their dependencies (such as datasets and custom styles).
- Click Data in the top navigation menu.
Select the connection where to import the artifacts.
We selected Samples, because we are connecting to the same data source for both systems.
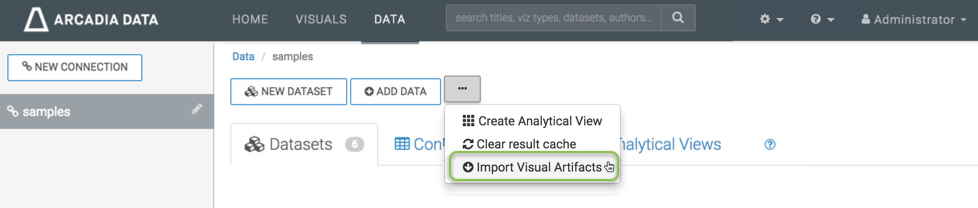
- At the top of the screen, click the (supplemental) menu.
-
In the (supplemental) menu, click the Import Visual Artifacts option.
-
The Import Visual Artifacts window modal appears.

-
Click Choose File.
Select the backup file in your file system. Here, we are getting
visuals_only_param_population.json, the file created in Exporting Dashboards.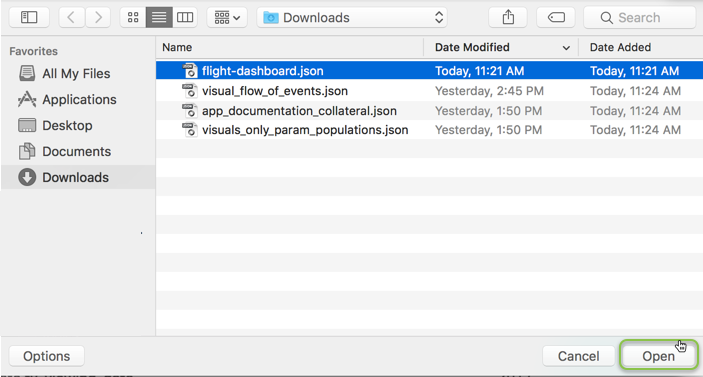
-
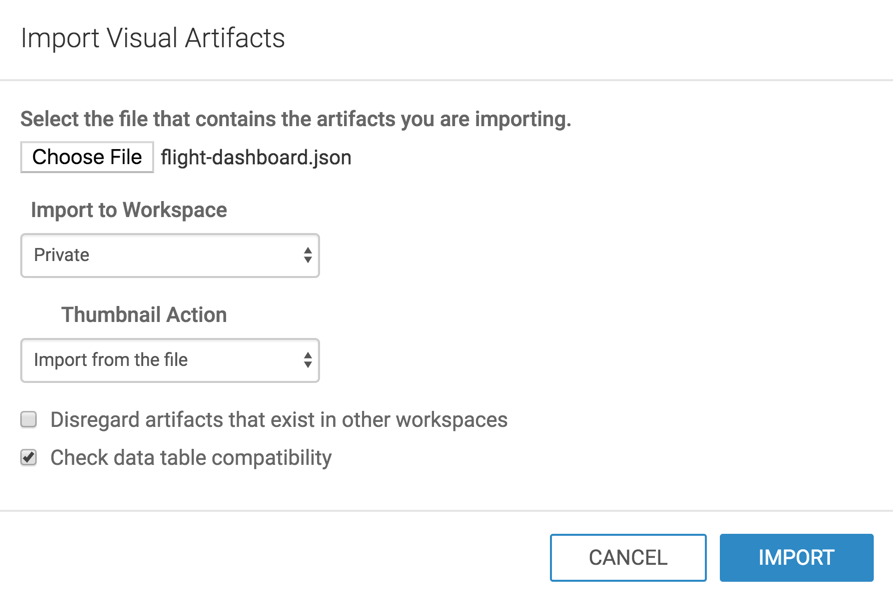
In the updated Import Visual Artifacts modal, notice the import options:
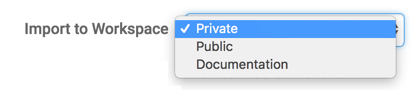
Import to Workspace
The drop-down menu enables you to specify the destination workspace. By default, Arcadia Enterprise imports the visual artifacts into the user's Private workspace. However, you can choose the Public workspace, or another workspace.
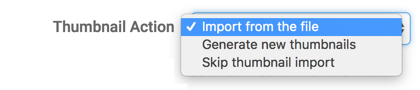
Thumbnail Action
There are three options for thumbnail handling:
- Import from the file
- Generate new thumbnails
- Skip thumbnail import
By default, Arcadia Enterprise imports the thumbnails from the file. However, you can choose to generate new thumbnails during the import process, or skip thumbnail import.
Disregard artifacts that exist in other workspaces (Off by default)
Before importing an artifact, Arcadia Enterprise searches for it on the system. If it already exists, it is either updated (if changed from a previous import), or left 'as is'. If it does not exist, it is imported as a new visual artifact.
By default, the search domain is the entire system. By selecting this option, you are limiting the search to the specified workspace.
Check data table compatibility (On by default)
This is a 'sanity check' that confirms that tables suitable for the incoming dataset(s) exist on the system. This means that the database and tables have the same names on the source and target systems.
After making the appropriate selections, click Import.
-
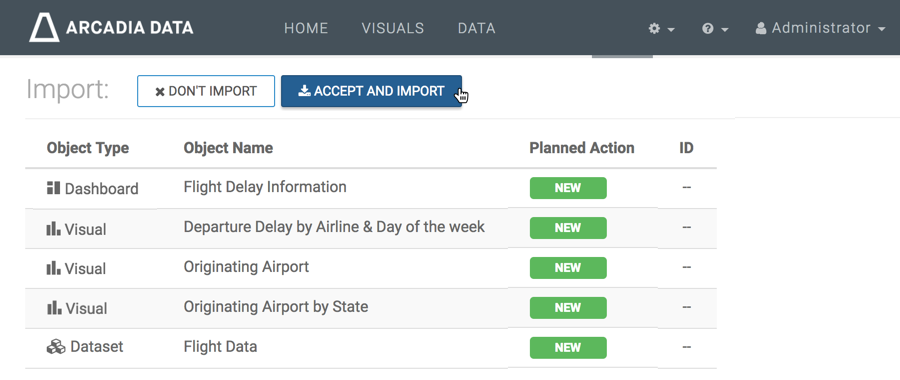
After processing the import
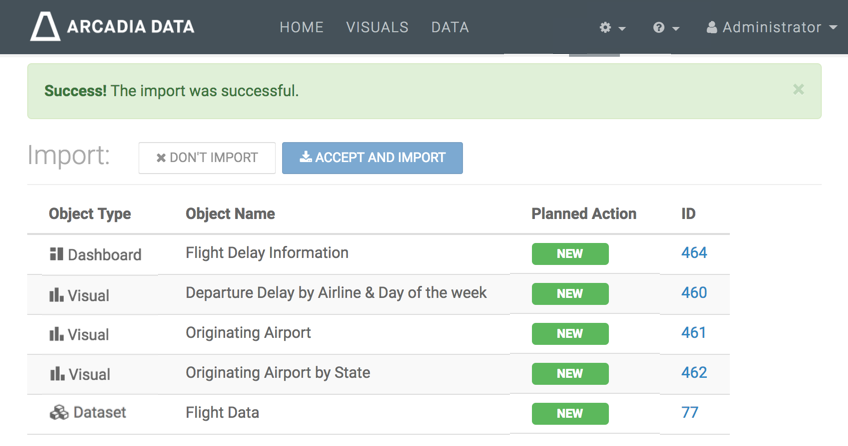
*.jsonfile, Arcadia Enterprise opens the Import interface to show its visual artifacts. Here, it displays the three visuals and the dataset that we saved earlier into theflight-dashboard.jsonfile, during export.Notice also that the Planned Action column shows that this is a new import for all artifacts. At this point, none of them have an assigned ID.
Click Accept and Import.
After the import completes, a Success message appears on the Import interface.
Notice that all the artifacts have an assigned ID. These are generated by the system, sequentially. Visuals/Dashboards and datasets have separate id queues.