Network Visuals: Same Source and Target Data Values
Network visuals may show the same node once, or several times on the same chart, depending on node settings.
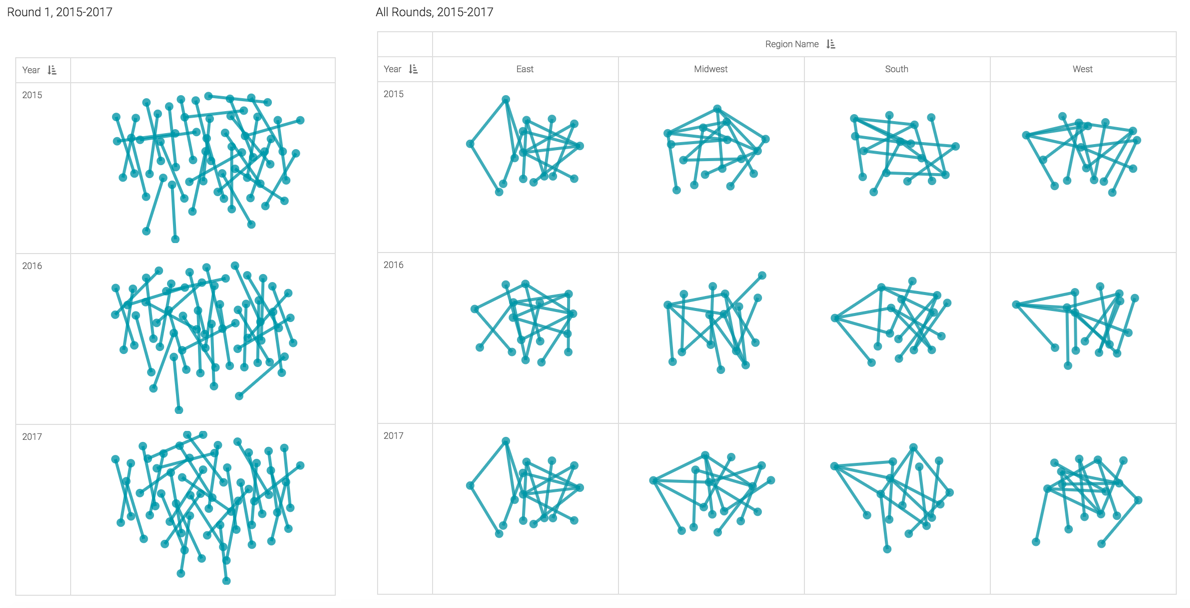
We are working with dataset NCAA Basketball, based on a visual developed in Network Visuals. The original visual shows only Round 1 play, or 1:1 match-ups.
- Clone the visual, and save it as All Rounds, 2015-2018. See Cloning Visuals.
-
Add
Region Nameto the X Trellis shelf. This shows all regions separately, and makes it easier to pick out the nodes that have multiple links. - Because this dataset defines the 'Final 4' and 'Championship' play as regions, add
Region Nameto the Filters shelf, and exclude these values. - To choose all rounds of play, remove the
Roundfield from the Filters shelf. -
In the Setting menu, open the Nodes menu, and select the option Source & target node data come from the same base values. We describe this option in Showing the Same Source and Target Values.
-
Click Refresh Visual.
-
Notice the difference between the two visuals: the one showing all rounds is much denser, and shows multi-branching from some of the same nodes.