Changing the Scale of a Continuous Axis on Dimensions
You can change the minimum and maximum scale of a continuous axis enabled on a dimension.
A continuous axis scale has an infinite number of possible values, in equal intervals. Compare it with a categorical axis scale, which has a finite number of evenly spaced values, limited to the values in the dataset.
To enable continuous dimension axis, see Enabling a Continuous Axis on Dimensions.
- Available only for numerical dimensions on Bars, Grouped Bars, Line, Area, and Combo visuals.
To change the minimum and maximum scale of a continuous axis on dimensions, navigate to the Axes menu, and make adjustments to the two selectors: Min Dim Scale and Max Dim Scaleoptions.
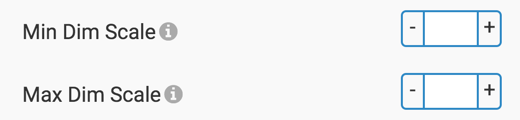
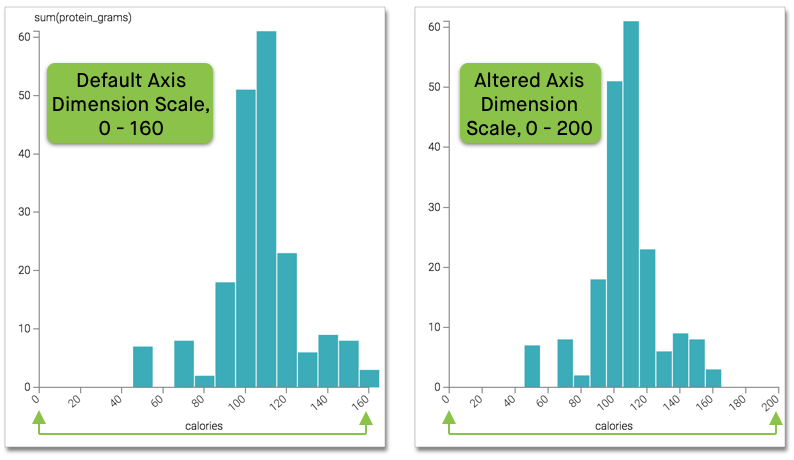
Image on the left shows the minimum and maximum scale of the X axis from 50 to 160. Notice that in the right image, the scale changes when we change the values from 0 to 200. Increasing the scale also gives a clearer visual representation of where the calorie levels fall within a range of values.