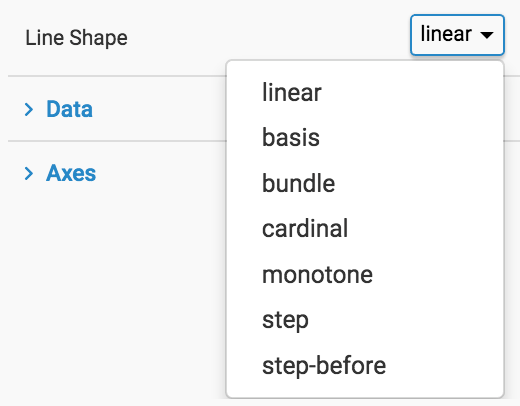
Changing the Line Shape
To change the style of a line (linear by default), navigate to the Marks menu, and select one of the options from the Line Style menu:
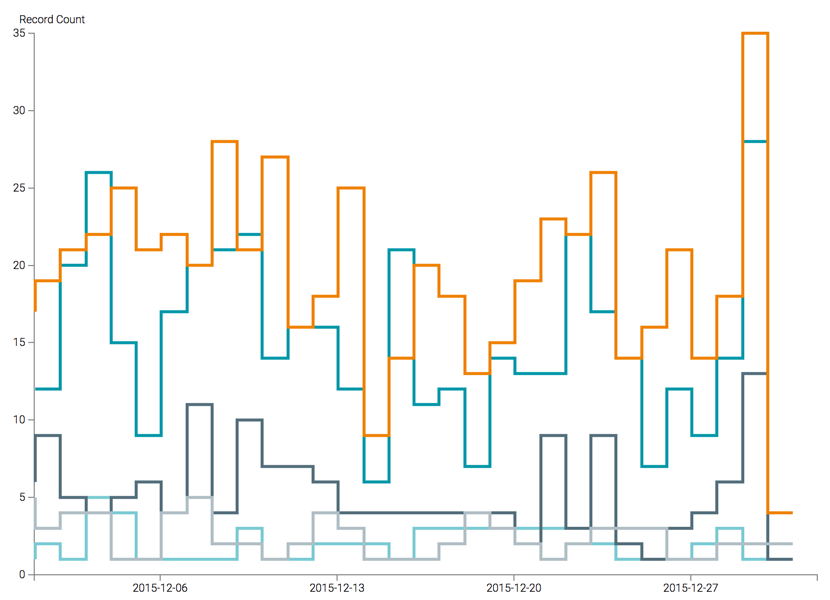
Linear Line Shape
The linear line shape, the default setting, is a normal jagged line comprised of piecewise line segments that connect the data points.

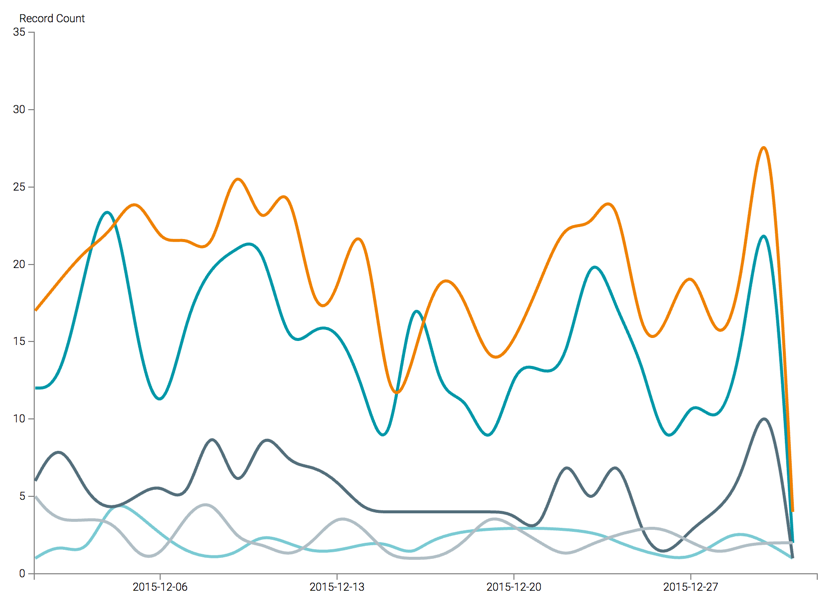
Basis Line Shape
The basis line shape implements curve-fitting using a B-spline interpolation formulas (generalization of the Bézier curve), with control point duplication on the ends.
Contrast this rendering with the one in Bundle Line Shape.
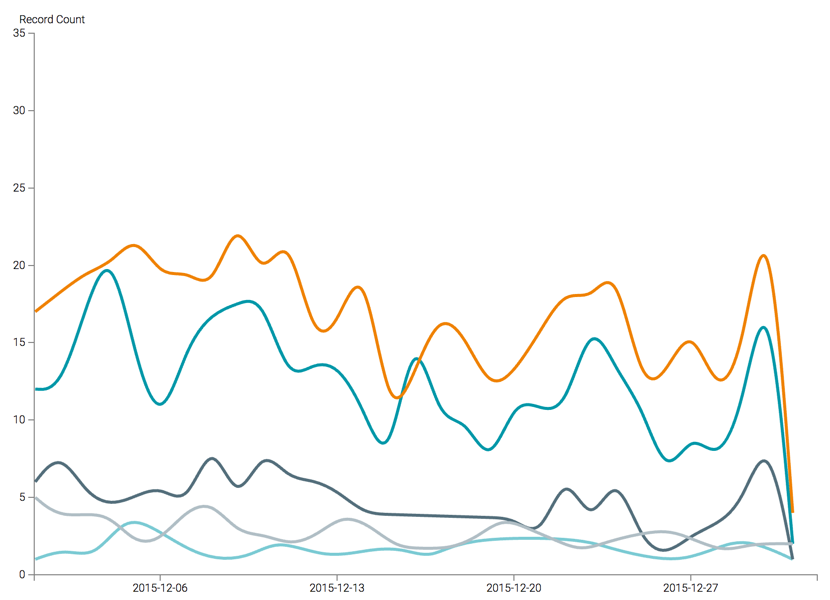
Bundle Line Shape
The bundle line shape implements curve-fitting using a B-spline interpolation formulas (generalization of the Bézier curve), with the tension parameter to straighten the spline.
Contrast this rendering with the one in Basis Line Shape.
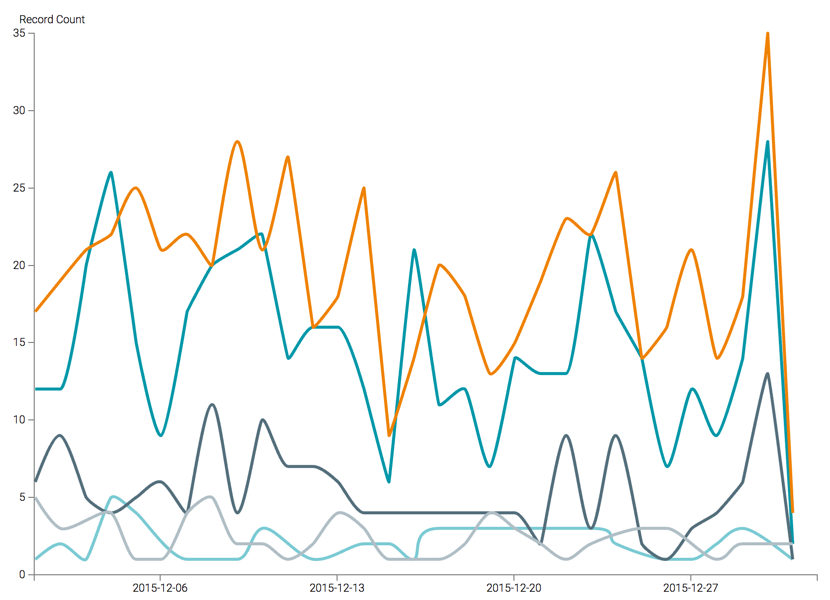
Cardinal Line Shape
The cardinal line shape implements curve-fitting using a Cardinal spline (or canonical spline) interpolation formulas that incorporate a tension parameter, with control point duplication on the ends.
Contrast this rendering with the one in Basis Line Shape.

Monotone Line Shape
The monotone line shape is a cubic interpolation that preserves the monotonicity on the vertical axis as it calculates the curve fit.
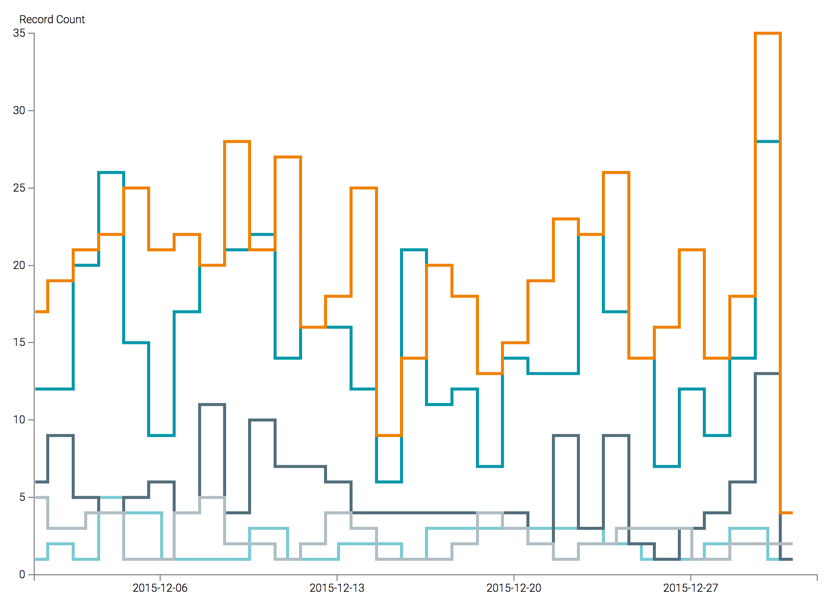
Step Line Shape
The step line shape, just as the name implies, alternates between horizontal and vertical segments, starting with a horizontal segment.
Contrast this rendering with the one in Step Before Line Shape.
Step Before Line Shape
The step before line shape, just as the name implies, alternates between vertical and horizontal segments, starting with a vertical segment.
Contrast this rendering with the one in Step Line Shape.