Displaying Totals With Data Expansion
When performing granular data analysis in cross tabulation visuals, you can display both subtotals and combined total. These summations operate on the dimensions in the Row shelf. When you enable expansion, you can expand rows to view details of some of the dimensions.
Follow these steps to enable expansion and display subtotals and totals in cross tabulation visuals:
Configuring a Cross Tabulation Visual for Expansion
In this example, we show how to enable expansion on the year and
state fields.
-
Start a new cross tabulation visual based on dataset
US State
                            Populations Over Time
[data sourcemain.census_pop]; See Creating Visuals. -
Populate the shelves from the available Fields (Dimensions, Measures) in the Data menu.
- Add
yearandstateto the Row shelf. -
Add
populationto the Measures shelf. Ensure that the default aggregation issum(population). -
Add
yearto the Filters shelf, set it to 1990 and 2000, and click Apply.Similarly, add
stateto the Filters shelf, select values AK, AL, AR, and AZ, then click Apply.
- Add
-
Click Refresh Visual.
-
When the cross tabulation visual appears, it does not have subtotals and the combined total in the rows and columns.
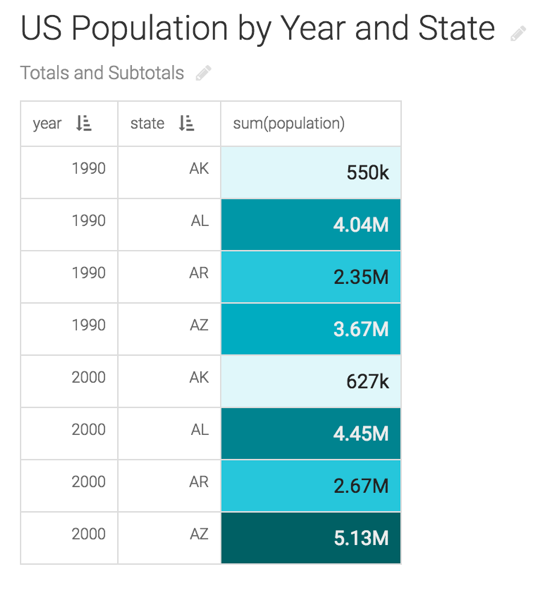
Next, let's enable these options.
-
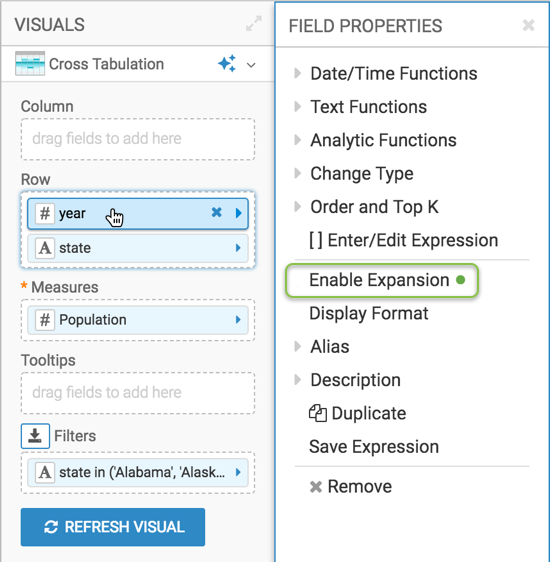
On the Row shelf, click
year. -
In the Filter Properties menu, click Expansion, and then click Enable Expansion. A green dot appears to the right of the option.
-
Similarly, click
stateon the Row shelf, and enable expansion on that field. - Click Refresh Visual to see the changes.
-
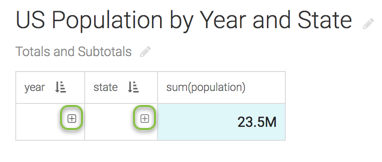
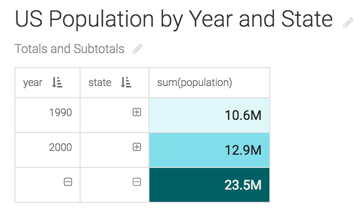
The visual appears with a icon in the year and state columns. This indicates that you can expand the data.
The sum(population) column shows the combined population for both years.
Displaying Subtotals and Totals
Follow these steps to expand and shrink the data rows, and display only subtotals and combined total in the visual.
-
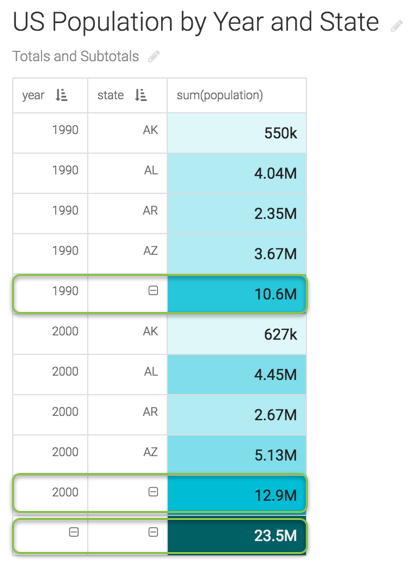
Click the icon in the year column.
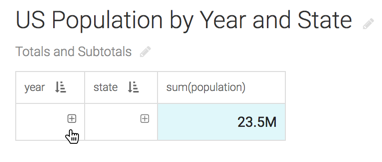
-
The visual expands the data to show subtotals of each year, and combined total for both years.
-
Click the two (plus) icons in the state column.
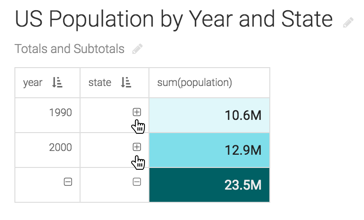
-
The visual expands the data to show population in each state, and the subtotals and combined population for both years.
Notice that the subtotals and combined total appear at the bottom of expanded rows. To move the subtotals and totals above the rows, see marks-move-expansion-totals.html#marks-show-column-totals.
To disable subtotals and combined total, make changes in the Field Properties menu by de-selecting the Expansion option.
Hiding Data and Subtotal Rows
To hide the expanded rows and subtotals, follow these steps:
-
Click the (minus) icon in the year and state columns.
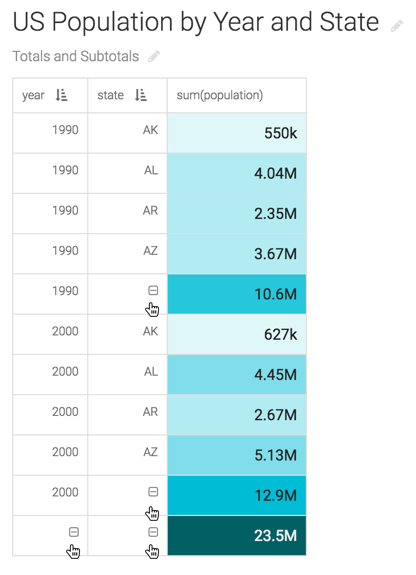
-
The expanded rows and subtotals no longer appear in the visual. Note that a (plus) icon appears again in the year and state columns.