Network Visuals: Node Size Shelves
By default, the nodes of the network visual have the same size. This visual has two data shelves, Source Node Size and Target Node Size, that produce a chart with nodes that represent values in the dataset.
To specify the size of the nodes, follow these steps:
-
Add the
Seed 1field to the Source Node Size shelf. - Click the
Score 1field on the shelf, to see the Field Properties menu. -
In the Field Properties menu, select [ ] Enter/Edit Expression.
- In the expression editor, specify a new calculation as a
max()aggregation function, with an alias:max([Seed 1]) as 'Seed' - Click Validate & Save.
- Similarly, add the
Seed 2field to the Target Node Size shelf. - Click the
Score 2field on the shelf, to see the Field Properties menu. -
In the Field Properties menu, select [ ] Enter/Edit Expression.
- In the expression editor, specify a new calculation as a
max()aggregation function, with an alias:max([Seed 2]) as 'Seed' - Click Validate & Save.
- Click Refresh Visual.
-
Notice the change to the appearance of the visual. Here, we show the tooltips for the visual to point out the size difference between Baylor (seed 3) and Xavier (seed 11):
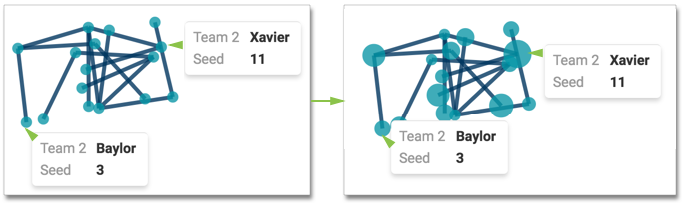
Specifying Node Size on Network Visual