Percentage Difference from Next Value Analytic Function
This article describes how to use the Percent Difference from Next Value analytic function in Arcadia Enterprise.
Create a basic line visual on the World Life Expectancy dataset, through an
Arcadia data connection. See Basic Visual for Aggregates.
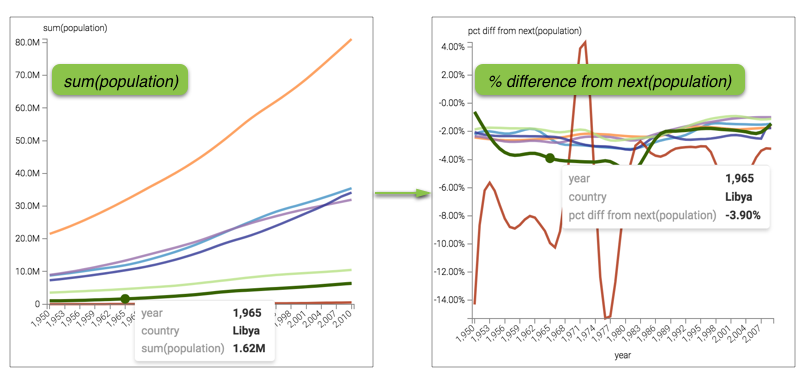
In our example, we compare the difference in population of Libya in the year 1965 and the next year 1966.
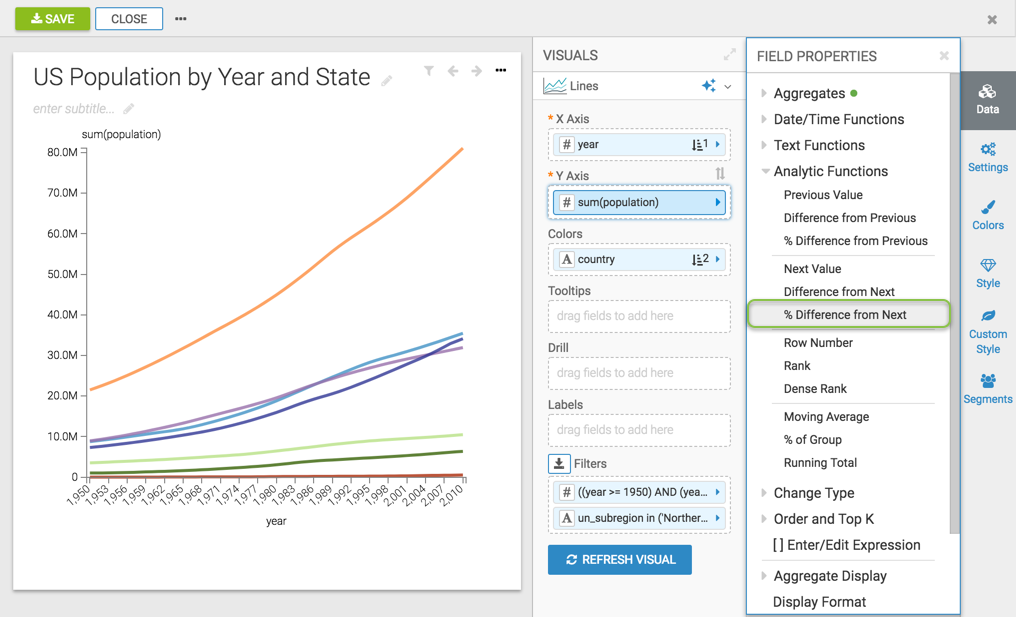
- Click the field on the measurement shelf, in this case, the
sum(population)field on the Y Axis shelf. - In the Field Properties menu, expand Analytic
Functions, and select % Difference from Next.
-
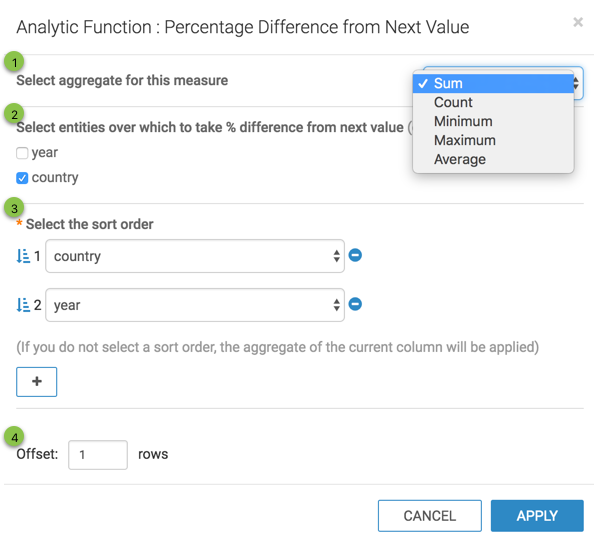
In the Analytic Function: Percentage Difference from Next Value modal window,
- In Select aggregate for this measure, leave the default Sum. The other aggregation options are Count, Minimum, Maximum, and Average. In addition, some connection types also support Approximate Distinct Count and Exact Distinct Count.
- Under Select entities over which to take % difference from next value, select country. This is the grouping that applies when calculating the % difference from next values.
-
Under Select the sort order, you can specify the order of sorting. This order specifies what the next row is, and the row where the value is taken. If your visual already specifies sorting order, these values appear in the modal.
You can add additional sort parameters, by clicking the (add/plus) icon.
Here, edit the sort order to be: country ascending, followed by year ascending.
- Under Offset, specify the number of next rows over which the function executes.
Analytic Function: Percentage Difference from Next Value - Click Apply.
-
[Optional] If you examine the expression in the Enter/Edit Expression interface, it shows that the function has the following form:
(sum([population]) - LAG(sum([population]), 1) over (partition by [country] order by [country], [year])) / LAG(sum([population]), 1) over (partition by [country] order by [country], [year]) as 'pct diff from next(population)' -
Click Refresh Visual.
-
Notice the change in the Y axis and tooltips, from displaying the
sum(population)in millions topopulationas a percentage difference from next value.Hover over any country to view the percentage difference of population from the next year. In the following example, the tooltip shows a decrease in the population of Libya from 1965 to next year 1966 by 3.90%.
Percentage Difference from Next Value Analytic Function Visual