Unless search phrase explicitly specifies the visual type, Arcadia Enterprise displays natural language search results using a visual type that best
matches the number and type of fields of the search, for every searched dataset.
Arcadia Data displays the results of a natural language search directly in the search
modal.
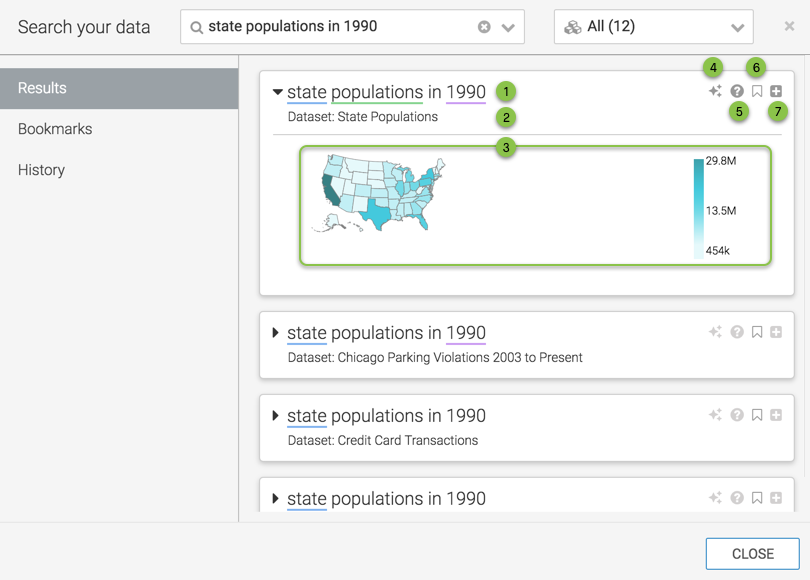
Note the main features of search results:
Search Results
Search Criteria
This is identical to your original search.
Result Dataset
The dataset where a particular search result is found. Note
that each search result may represent a different dataset.
Result Visual
The search result itself is a visual. Note that Arcadia Enterprise displays results in a default visual type that best represents
the number and type of fields in the search phrase.
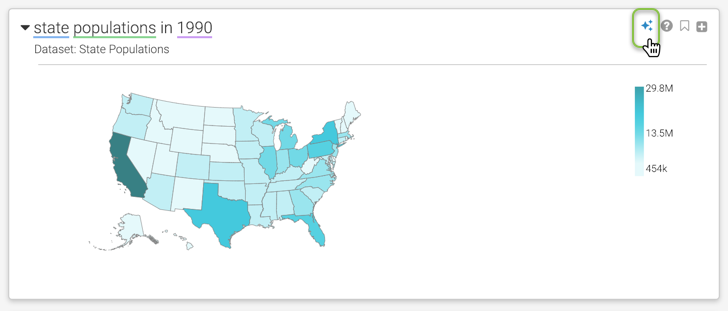
You can change the display type,
either by specifying the visual type in the search string and starting a new search, or by
clicking the (explore) icon to
preview results in alternate visual types.
Explore
Clicking the (explore) icon enables you to choose an alternate visual.
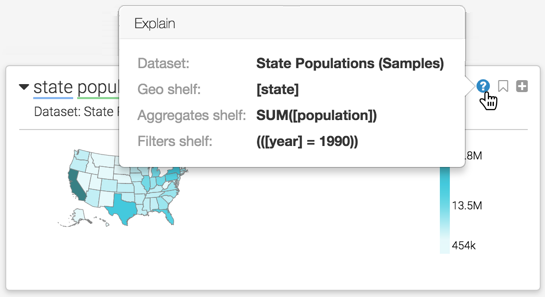
When you click the
(explain) icon, it opens a tooltip that explains the parameters of the result visual:
its dataset, the measures and dimensions on its shelves, filters, and sort.
In
our example, the dataset is State Populations. The three populated shelves are:
Geo Shelf
[state]
Aggregates Shelf
SUM([population])
Filters Shelf
(([year] = 1990))
Explain the Result Visual
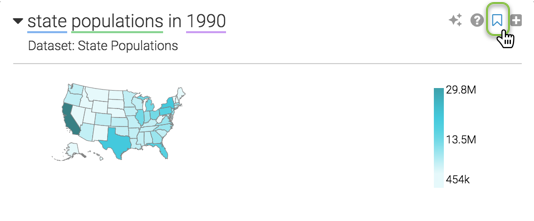
Bookmark
Click the
(bookmark) icon to add the visual to the bookmarked results. To remove the bookmark, click
the
(bookmark) icon again. See Search Bookmarks for more
information.
Bookmark the Result Visual
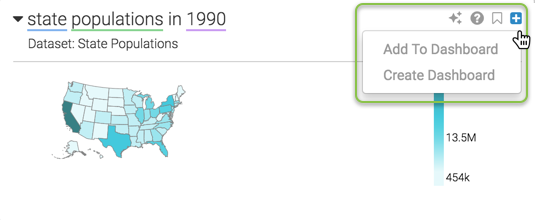
Dashboard Actions
When the visual matches your needs, you can save it for
later use by placing it in a dashboard. Click the (add)
icon.
Add Visual to Dashboards
Now choose from one of the following options:
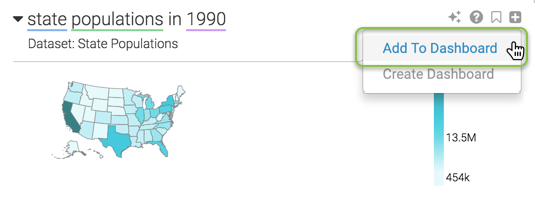
Add to Dashboard
Selecting this option adds this visual to an existing dashboard.
Add Visual to Existing Dashboard
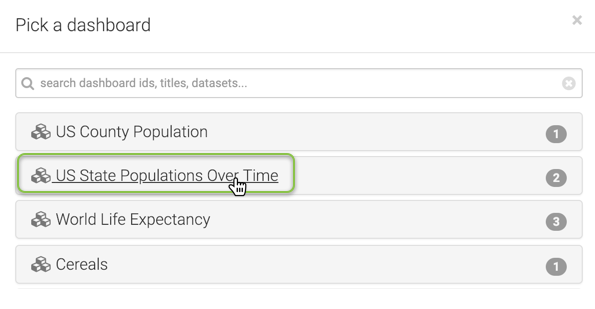
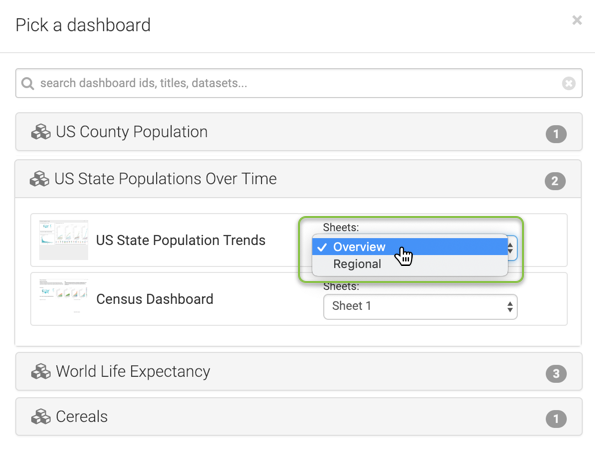
In the Pick a dashboard window modal, select the
relevant dataset.
Choose the Dataset
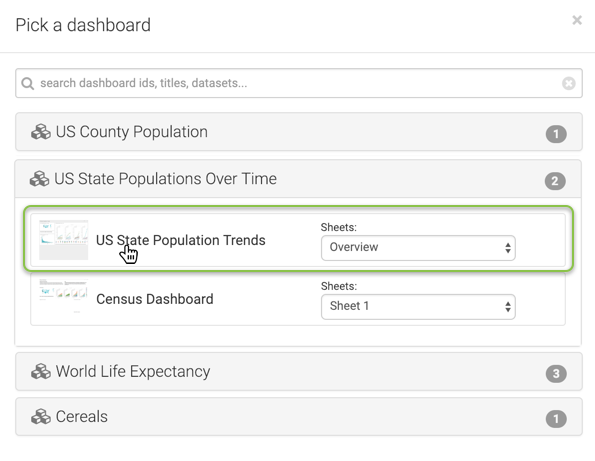
When the dataset expands to show the list of available dashboards, select the
dashboard where you want to add the new visual.
Choose the Dashboard
Notice that for dashboards with multiple sheet, you can choose the sheet for
the new visual, by name.
Choose the Sheet
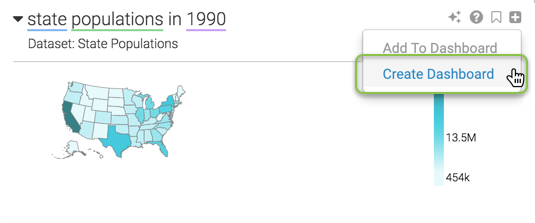
Create Dashboard
Selecting this option creates a new dashboard that contains this visual.
Add Visual to New Dashboard
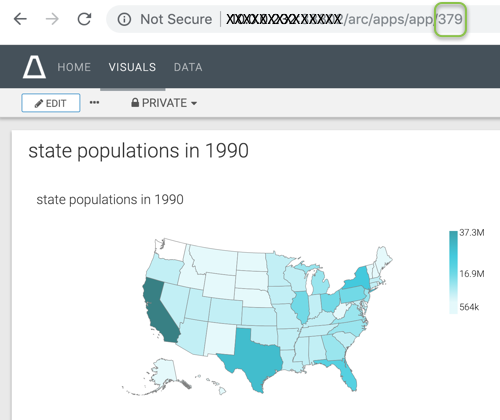
After the system creates a new dashboard, it displays a success message that
includes the ID of the new dashboard. In this example, the ID is 379.
When you navigate to the new dashboard, you notice that both it and the visual
has the title that is identical to the original search question. Dashboard Created from the Search